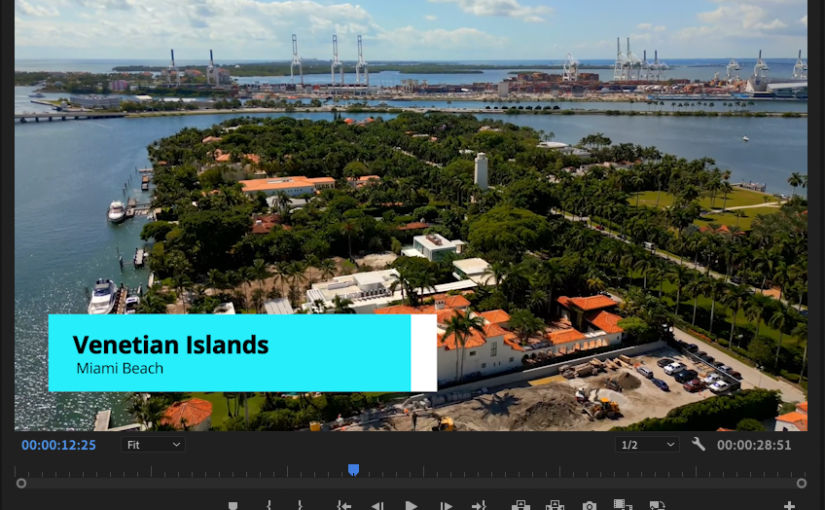
A lower third is a text title or graphic overlay placed in the lower region of the screen. Motion Graphics templates are a file type (.mogrt) that can be created in After Effects or Premiere Pro. Here’s an example of a motion graphic lower third.
There are many motion graphic templates for lower thirds available online, e.g.
In this tutorial, I just get a free one from Mixkit.
Download MOGRT template
Download this free template and unzip it. You’ll get an mogrt file and an mp4 file showing how the animated title looks.
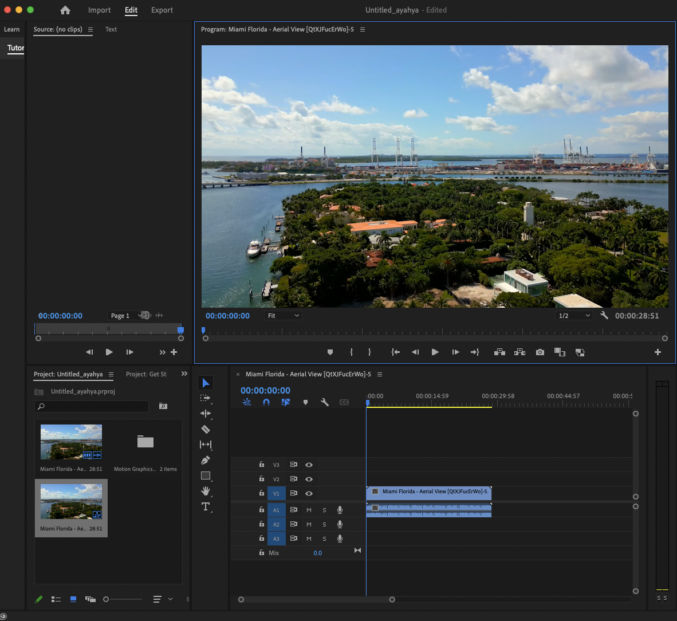
Add a video to your timeline in Premier Pro
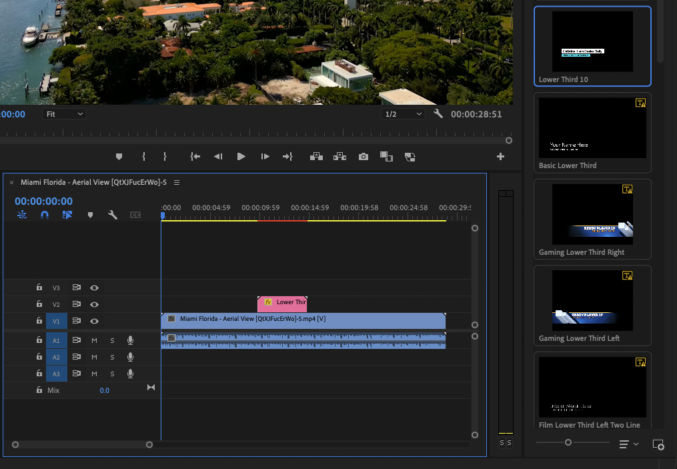
Drag a video to the timeline pane.
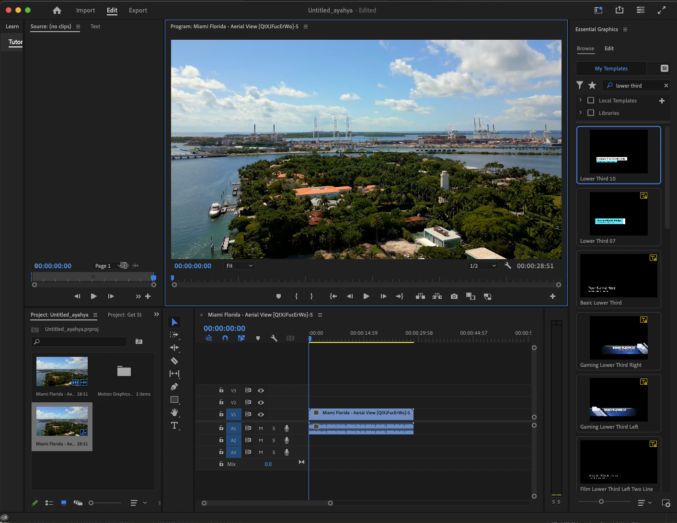
Open the Essential Graphics pane
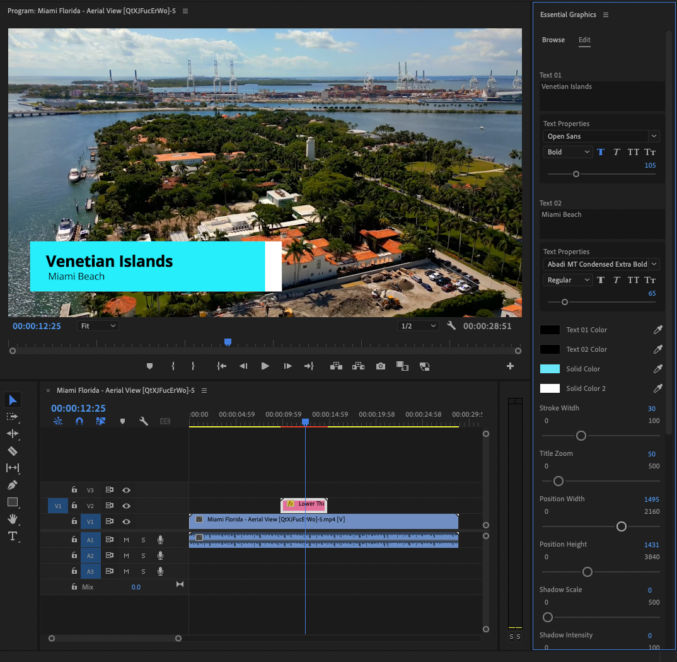
Click on Window > Essential Graphics. You’ll see the Essential Graphics pane on the right.
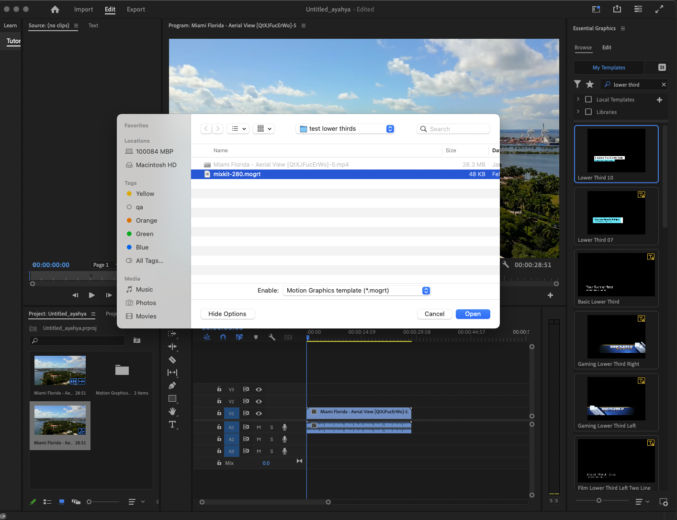
Install the mogrt file
In the Essential Graphics pane, click the “Install Motion Graphics template” button in the bottom right corner. Browse to the mogrt file and click Open. The template will appear at the top of the list of templates in the Essential Graphics pane.
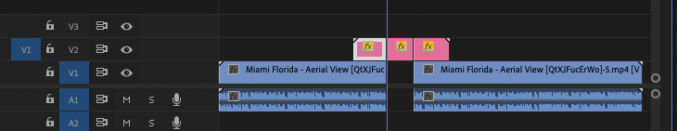
Drag the template to the timeline
I dragged it to the V2 track.
Edit the template
Double-click the motion graphics clip in the timeline (pink bar) to edit the template. Depending on the template, you can edit the text, colors, size, positioning, etc.
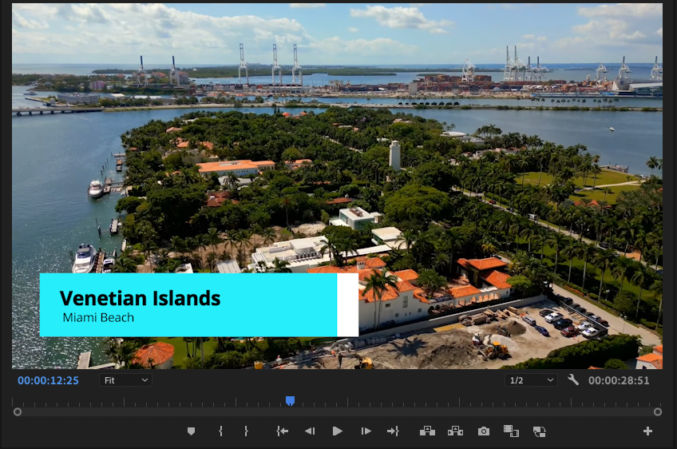
Preview the lower thirds title
Click the play to preview the lower thirds animated title. You may find the duration to be too short.
Extend the duration of the lower thirds title
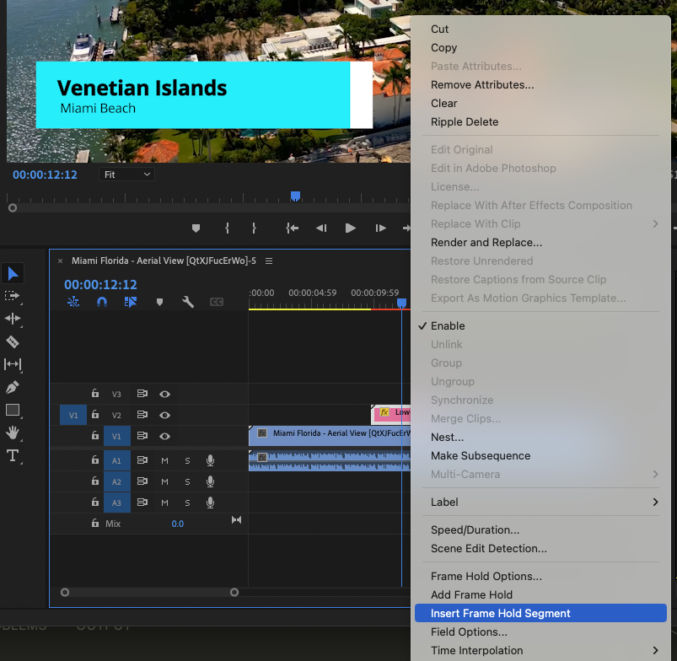
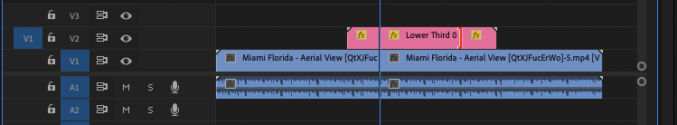
Move the playhead in the timeline to the point where the title text is fully shown and not moving. At that point, right-click on the motion graphic clip in the video track (pink bar) and click on “Insert Frame Hold Segment”.
This will split all clips at that timestamp and the motion graphic clip will be split such that you can extend the middle subclip, which is the clip containing the frame showing the full title text, to increase the duration of the title. You will need to move the right subclip of the animated title to the right to make room to extend the duration of the middle subclip.
For the split video clip, just drag the right clips toward the left clip.
You may end up with something like this.
Preview the animated lower thirds title. If it looks good, export the video. Otherwise, tweak the title further.
The video below is the same video but with the text removed.
Same video with text / watermark removed
We can remove objects like text and watermarks from videos using Adobe After Effects (AE) content-aware fill feature. Here’s how I did it for the video above.
1. Open your video in Adobe After Effects
Choose “New Composition From Footage” and select your video.
2. Shorten work area
The content-aware fill takes a long time to process. To speed up testing, shorten the work area to a 2-second section by dragging the blue start and end markers on the timeline.
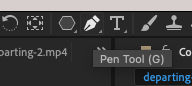
3. Create a mask
Click a tool like the pen tool and create a mask area around the object (in this case, text) you want to remove.
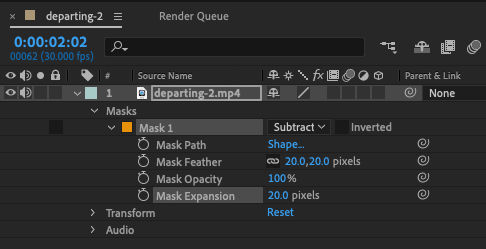
4. Adjust mask settings
In the video track, expand the Masks and select “Subtract”. For the Mask Feature, choose 20 pixels for the vertical and horizontal feather. For the Mask Expansion, choose 20 pixels as well. Play with these settings until you find values that produce good results.
These changes cause the mask to look like this
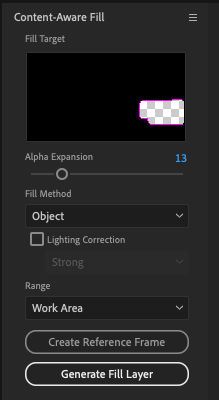
5. Adjust content-aware fill settings
If the content-aware fill pane isn’t open, open it by going to Window > Content-Aware Fill.
For the alpha expansion, I set the value to 13. You can experiment with different values.
For the fill method, choose “Object”.
For the range, choose “Work Area” because we only want to apply the fill to the short 2-second work area for now.
Click the “Generate Fill Layer” button. You will be asked to save the project if you haven’t already done so. You will then see AE analyze and generate the fill layer.
You will see the fill layer above the video layer in the list of tracks / layers.
6. Preview the content-aware fill layer
Click the play button in the preview pane to preview the content-aware fill.
This is how it looks for me. I think that looks good. If it doesn’t look good, go back and tweak some of the previous settings and try again.
7. Apply content-aware fill to the entire range containing the text to remove
Move the blue start and end work area markers to the beginning and end where the object / text you want to remove.
Disable the test content-aware fill layer by toggling the eye icon.
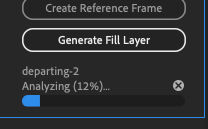
In the content-aware fill pane, click “Generate Fill Layer”. AE will create a new content-aware fill layer above our test layer. If the work area duration is long, this will take time to process.
Content-are fill will go through an analyzing phase followed by a rendering phase.
8. Preview complete content-aware fill effect
Click the play button in the preview pane again to see how the fill effect looks in the entire clip. If it looks good, you can export the video.
9. Export the video
Click File > Export > Add to Render Queue.
If the output location is unspecified, choose an Output To location. Then click the Render button.
Update: Use a reference frame for better results. The more reference frames, the better the results.
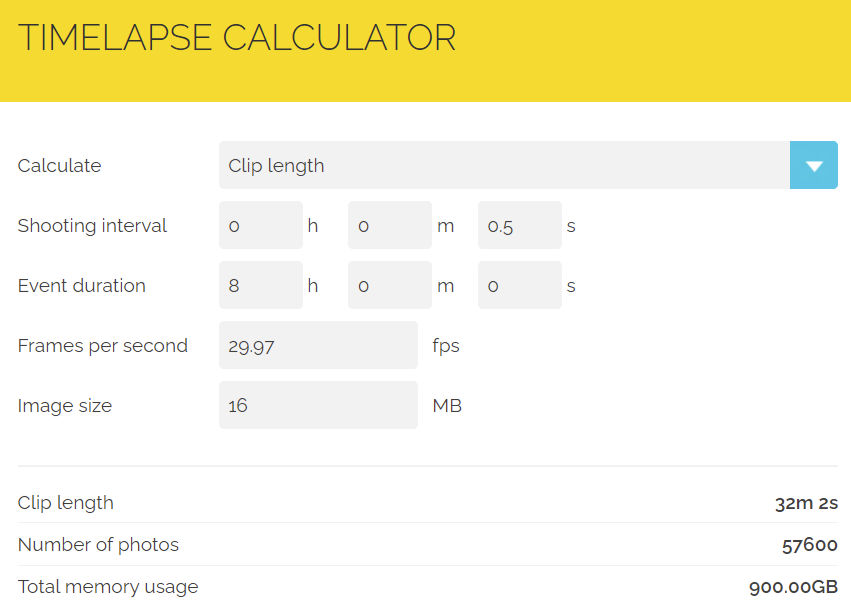
You can create timelapse videos using the Insta360 ONE X2/3. The resulting timelapse will be a 360-degree video that you can edit the same way you can non-timelapse videos. Unfortunately, the interval setting between when a picture is taken to create the timelapse can only be set from your phone. The interval options are 0.5s, 1s, 2s, 4s, 10s, 30s, 1min, 2min. Note that standard video is 29.97s, which is like making a timelapse video where the interval between still images is 1/29.97s or 0.03s. According to this timelapse calculator, if you film for 8 hours straight (event duration) with a shooting interval of 0.5s, then the camera will take 57600 photos. If you want the resulting timelapse video to have a frame rate of 29.97 fps, then the resulting timelapse video duration will be 32m 2s long.
Here are the number of photos and video durations for an 8-hour event duration for the shooting intervals supported by the ONE X2.
Interval
Number of Photos
Video Duration
0.5s
57600
32m 2s
1s
28800
16m 1s
2s
14400
8m
4s
7200
4m
10s
2880
1m 36s
30s
960
32s
1min
480
16s
2min
240
8s
I wouldn’t choose a timelapse interval greater than 10s since an 8-hour-long filming session would produce a video that’s longer than 1m 36s. If 1m 36s is too long, then in post-production, whether in Insta360 Studio or some other video editing program, you can speed up the timelapse to produce an even shorter video.
The battery that comes with the Insta360 ONE X2 is good for 80 minutes. You can buy additional batteries, but if you’ll be recording a long timelapse video, it would be annoying to have to keep changing the battery every 80 minutes. In this case, you’re better off recording with the USB charging cable plugged in. To prevent overheating, remove the battery. The camera can still operate and record while plugged in.
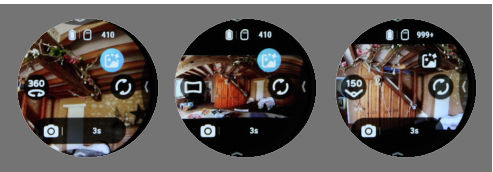
When taking a 360-degree timelapse video, make sure the following options are set
360-degree mode (not 150-degree mode)
Left to right: 360-degree mode, panorama mode, 150-degree wide-angle mode
Video timelapse mode
Slow Motion Videos
If you want to make a slow-motion video, e.g. a real estate tour video, then you definitely want to record at a high frame rate like 60 fps. Then, in your video editor, slow down the video and export it at 30 or 60 fps. If the original video is recorded at 30 fps, then the slowed-down video will be choppy.
https://www.youtube.com/watch?v=6ywQnh2gmX0
Action Videos
When filming action scenes, it’s better to record at a high frame rate so that playback will be sharp, more fluid, and not blurry.
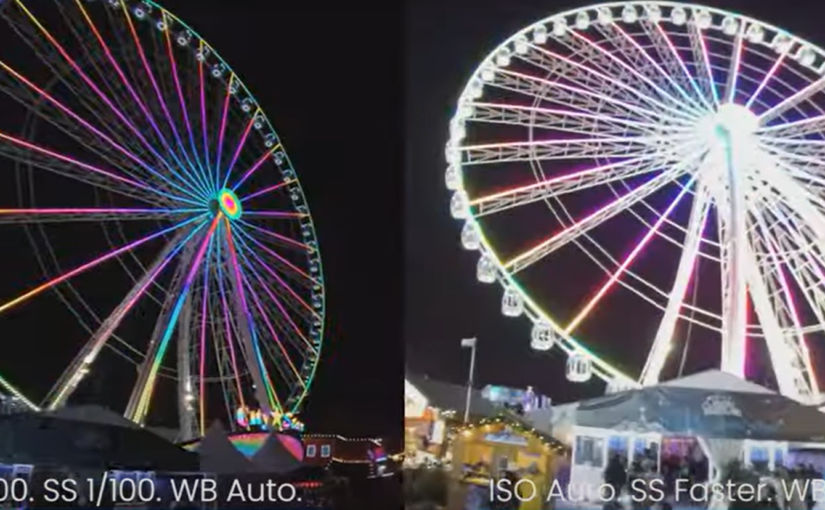
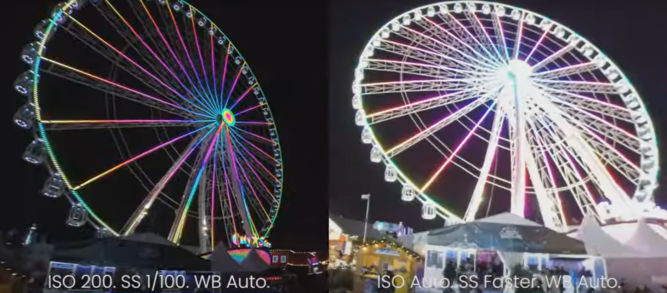
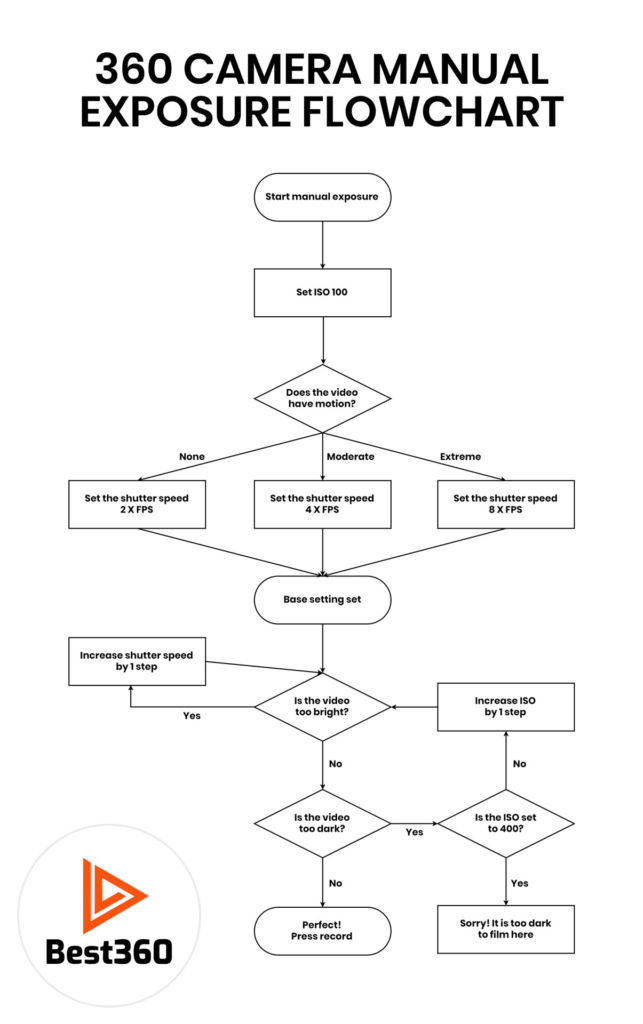
Low-Light / Night Scenes
When filming in low light like at night, you’ll get much better results if you manually adjust the exposure.
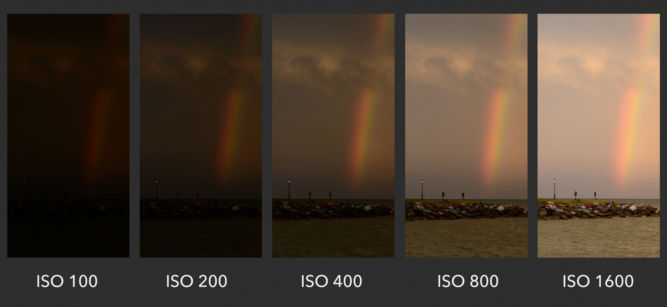
ISO
ISO is a camera setting that will brighten or darken a photo.
However, if you increase the ISO too high, you’ll see a lot of grain.
You should only raise your ISO when you are unable to brighten the photo via shutter speed or aperture instead (for example, if using a longer shutter speed would cause your subject to be blurry). The ISO 200 image on the left was brightened with a long shutter speed.
Shutter Speed
Shutter speed is responsible for two particular things:
changing the brightness of your photo and
creating dramatic effects by either freezing action or blurring motion.
Shutter speed is the length of time in seconds the camera shutter is open, exposing light onto the camera sensor. Essentially, it’s how much time your camera spends taking a photo. When the shutter is open, light passes through the lens and is collected on the camera sensor. The button that fires the camera is also called “shutter” or “shutter button,”
Fast / Short Shutter Speed > Freezes Action
A fast shutter speed is a small fraction of a second, like 1/250th of a second.
Slow / Long Shutter Speed > Motion Blur
A long shutter speed is 1 second or longer. A slow shutter speed is like 1/2 or 1/4 of a second.
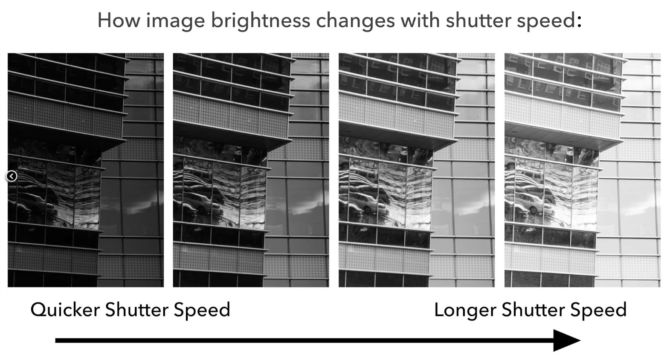
Shutter Speed and Exposure (Brightness)
If you use a long shutter speed, your camera sensor gathers a lot of light, and the resulting photo will be quite bright. If you use a quick shutter speed, your camera sensor is only exposed to a small fraction of light, resulting in a darker photo.
The following flowchart can help you tweak the ISO and shutter speed.
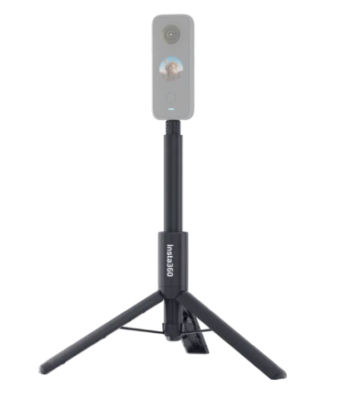
Following are how some videos look when using each stick.
3.4′-long selfie stick, front, face level
10′-long selfie stick extended to about 5′, front, face level
3.4′-long selfie stick, front, stomach level
3.4′-long selfie stick, 45-degree angle, face level
3.4′-long selfie stick, side, face level
3.4′-long selfie stick, side, face level
3.4′-long selfie stick, front, feet level
3.4′-long selfie stick, straight up
10′-long selfie stick, straight up
10′-long selfie stick, up, back
10′-long selfie stick, up, side
10′-long selfie stick, front spin, face level
10′-long selfie stick, low to high, facing down
10′-long selfie stick, low to high, facing up
Selfie Drone
For comparison, following are some videos taken with the Hover Air X1 selfie drone.
Bird’s Eye, no spin, 10 feet
Bird’s Eye, no spin, 10 feet, return
Bird’s Eye, no spin, 50 feet
Bird’s Eye, no spin, 50 feet, return
Bird’s Eye, fast spin, 50 feet
Bird’s Eye, fast spin, 50 feet, return
Bird’s Eye, slow spin, 50 feet
Bird’s Eye, slow spin, 50 feet, return
Dolly track
Dolly track
Follow
Hover with target tracking
Orbit, 5 feet
Orbit, 20′
Zoom out, down
Zoom in, down, return
Zoom out, flat
Zoom in, flat
Zoom out, up
Zoom in, up
Zoom out, up, far
Zoom in, up, far
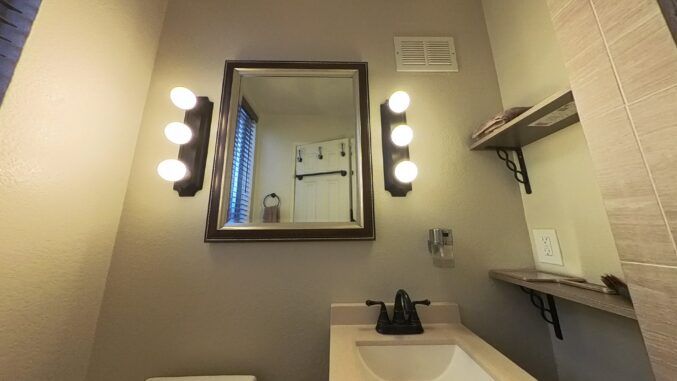
Lens Care
The Insta360 X2/X3 camera has protruding lenses on two sides. As such, the lenses can easily get scratched, so extreme care must be taken to prevent that from happening. Also, before shooting, you should always clean the lens to remove any dirt or fingerprints. A dirty lens can easily result in a blurry shot. Following are comparisons of image quality when different lens conditions.
Brand New and Clean Lens
The image quality is relatively sharp.
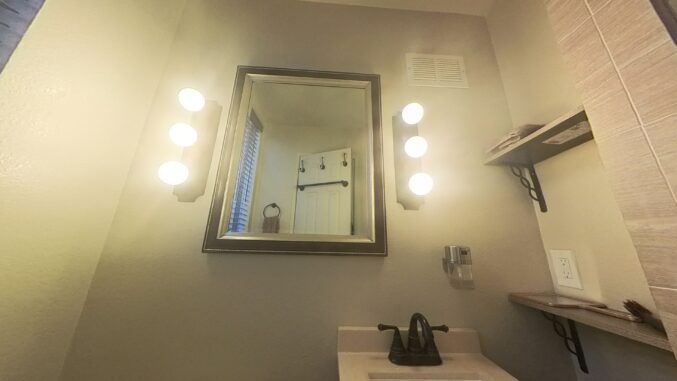
Brand New Lens But Full of Fingerprints
The image is blurry, especially around the lights.
Scratched But Clean Lens
Despite being cleaned with a new cloth, the image is partially blurry due to the scratched part of the lens.
There are at least 3 major things that affect music audio quality:
Speakers
Audio source, e.g. mp3 file, FLAC file, etc
Digital-to-Analog Converter (DAC)
Some people may argue that transmitting audio over Bluetooth degrades sound quality, but the reality is the difference is so small that it’s negligible.
Speakers
Needless to say, quality speakers are necessary to hear music at a higher quality. Don’t expect to hear quality audio from cheap $10 earphones. Since I’m not an audiophile and I’m not interested in spending thousands of dollars just for speakers, I just have what I guess are prosumer speakers. Specifically, I have:
And since it makes no sense to buy them at full price, I buy them renewed on Amazon for a big discount because even renewed, they look and function exactly like they are brand new.
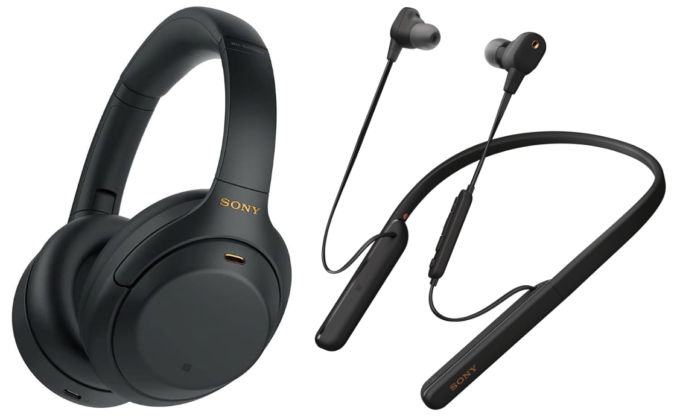
The WH-1000XM4 has a better sound stage, but it’s bulkier and leaks audio a lot. Also, it’s not great for working out because I feel it moves around too much and gets in the way of my workout. The WI-1000XM2 is compact, doesn’t leak audio, and can easily rest on my neck when not in use. The problem is when listening to music on my phone, the volume is often not high enough, especially when at the gym or when traveling by plane. This is where having an amplifier (amp) takes care of volume issues.
Audio source
I’ve dabbled with lossless FLAC files, but when compared to high-bitrate mp3 files, I personally can’t notice a big enough improvement to justify the cost and huge file size. I’m okay with mp3s as long as the bitrate is high enough. I normally just buy mp3s from Amazon Music. Don’t expect to hear quality audio from low-bitrate mp3s, though. The compression is too lossy.
Digital-to-Analog Converter (DAC)
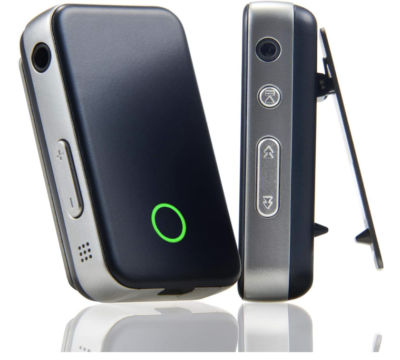
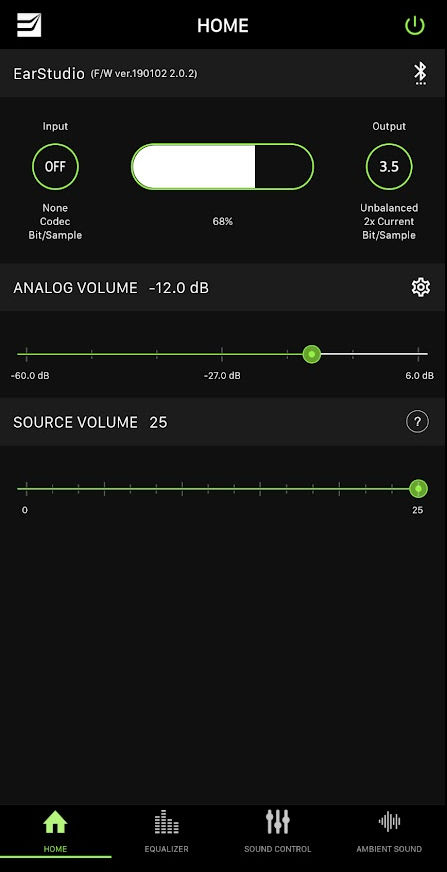
Chances are you probably listen to music from your phone and sometimes from your laptop like me. The problem is the converters in them that convert digital audio signals to analog signals are likely of low quality. I have the Google Pixel 4a 5G smartphone. It’s a mid-range phone. But even if you have a high-end phone, the digital-to-analog converter (DAC) is most likely not as good as a dedicated DAC. Fortunately, there are small Bluetooth DACs that are lightweight and can clip onto your shirt. I tested the EarStudio ES100 MK 2 ($60 renewed, $80 new on Amazon).
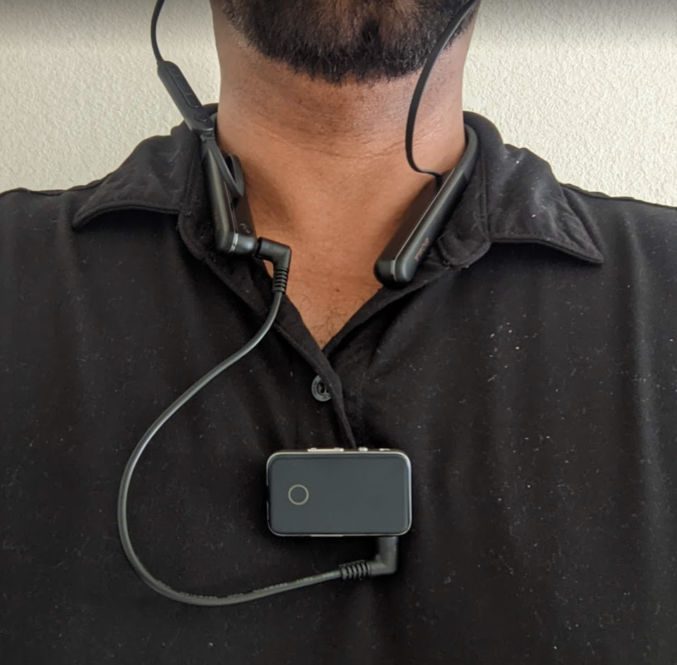
When comparing the audio quality with and without this DAC, it’s clear that the DAC makes a decent, if not big, difference, depending on the song I’m listening to. The DAC is also an amplifier and can increase the volume to levels higher than I’d ever need it to be. It didn’t come with an aux cable, so I bought a short 4-inch one. The setup might seem complex, but it’s not that bad, especially if you’re just sitting for a long time, like on a long flight.
Instead of pairing your head/earphones to your audio source (phone, laptop, etc), you pair the DAC to it.
Though it has volume controls, I find it easier to adjust the volume from the phone app. It’s recommended to set the source volume (phone or laptop volume) to max and to adjust the analog (DAC) volume. The app has a lot of options and clear explanations, but I find the default settings to be sufficient.
In Google Earth Pro for Desktop, you can record a tour in real time by clicking the navigation controls or by clicking on saved placemarks. However, unless you are just moving from one point to another, the resulting tour may not be as smooth as you’d like. For example, if you have three placemarks, then as you click each placemark while recording the tour, the transition between placemarks will not be smooth.
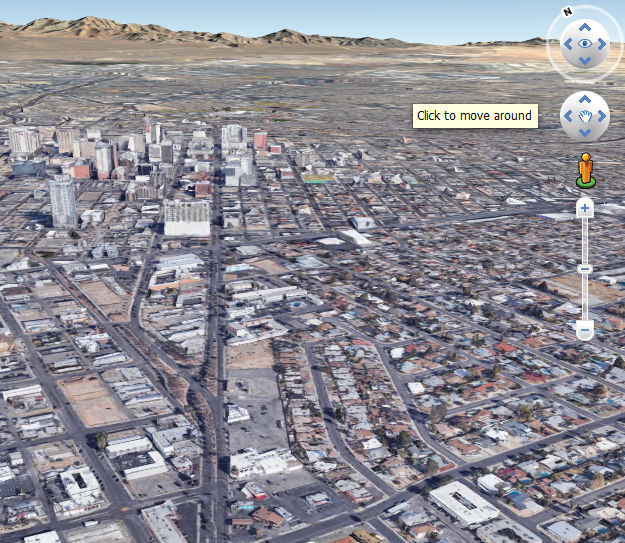
To create a smooth tour that appears as if you are flying a plane or drone at a fixed altitude along a multipoint path, you need to create a path in Google Earth. Here’s an example. Let’s say we want to fly along the Las Vegas Strip.
Change Settings
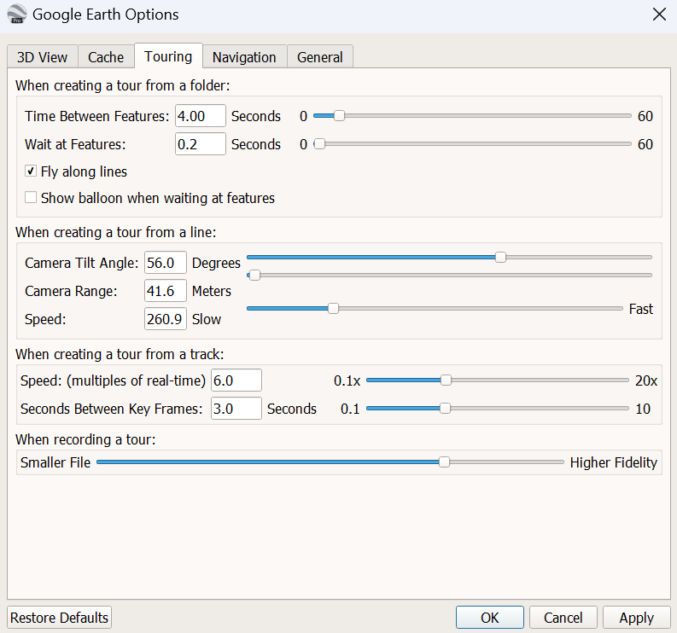
Go to Tools > Options > Touring and change the settings as in this screenshot. Make sure to click the “Apply” button and the “OK” button to save your changes.
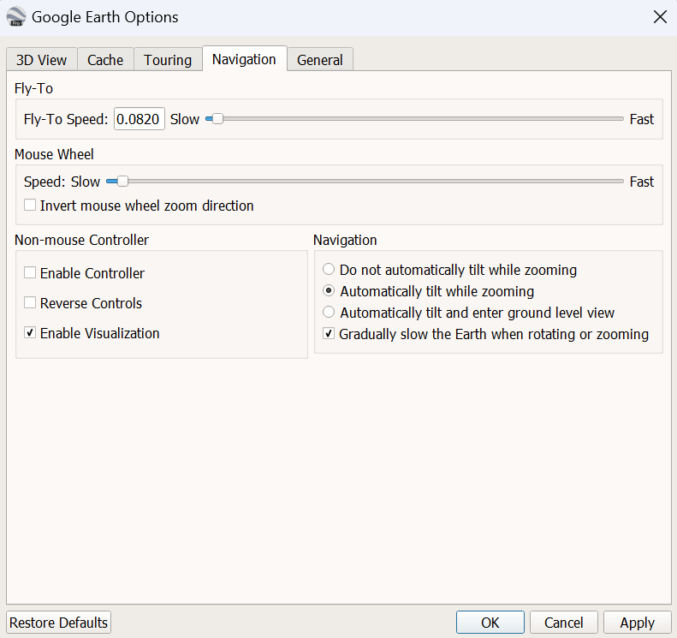
Now, click the “Navigation” tag and change the settings to match this screenshot.
Create Path
When adding a path, your mouse pointer will turn into a crosshair and you will need click to add points along your desired path. In this mode, you will not be able to zoom, change altitude, direction or pan by clicking on the screen because doing so would add path points. If you need to move around, you’ll need to use the navigation controls.
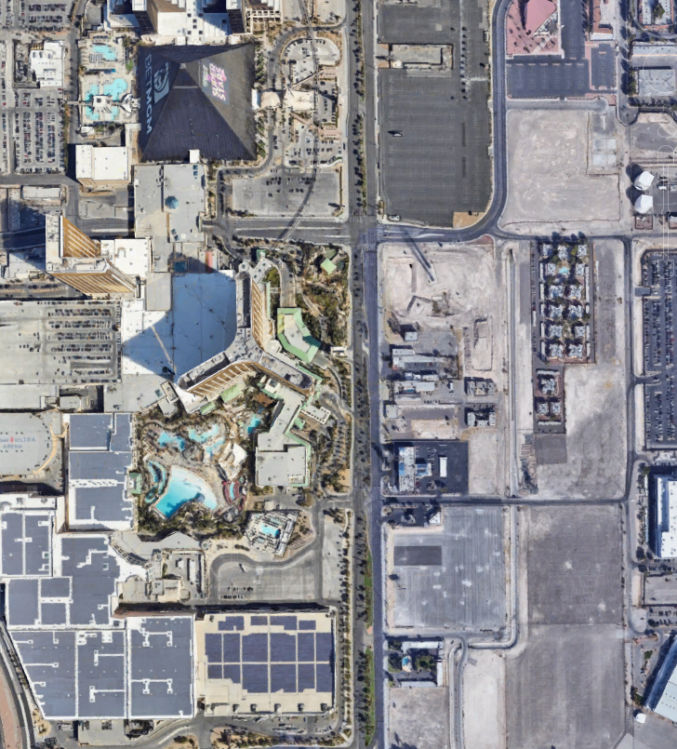
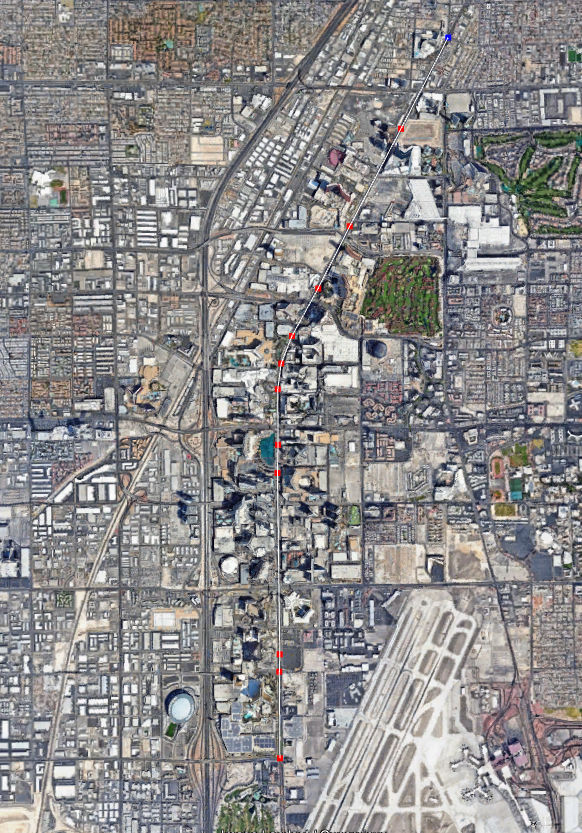
When creating a path, I find it easier to have your view facing straight down to the ground like this. In this example, my starting point will be just south of the south end of the Strip before the Mandalay Bay.
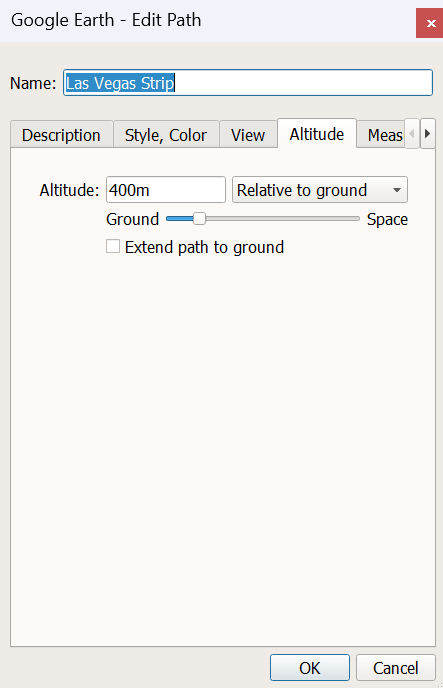
Click Add > Path
A dialog window will pop up. We’ll name the path “Las Vegas Strip”. Let’s also specify the altitude we want our flight path to be from the ground.
Click the “Altitude” tab.
Set Altitude to “400m” for 300 meters.
Make sure “Relative to ground” is selected.
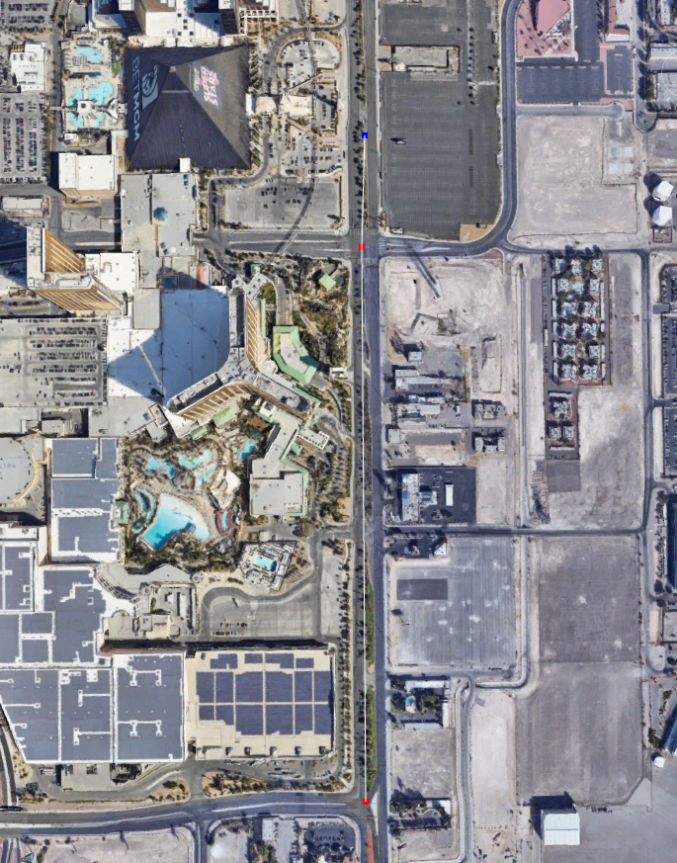
Click to add path points
In the screenshot below, you’ll see that I created 3 points. From bottom to top, there’s 2 red points and 1 blue point.
Since I need to pan to the north to add more points along the Strip, I will use the navigation control up arrow to do so.
After adding all the last point (just north of the STRAT), I zoomed out to check the entire path. As you can see, all but the last point are red and the path curves to the right as it goes north.
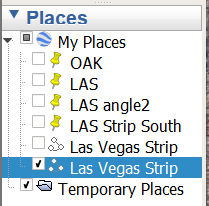
Now that my path is done, I’ll click the OK button in the path dialog window. That adds the path to My Places.
Since I don’t want to see the white path line / curve, I’ll uncheck the checkbox next to the path name.
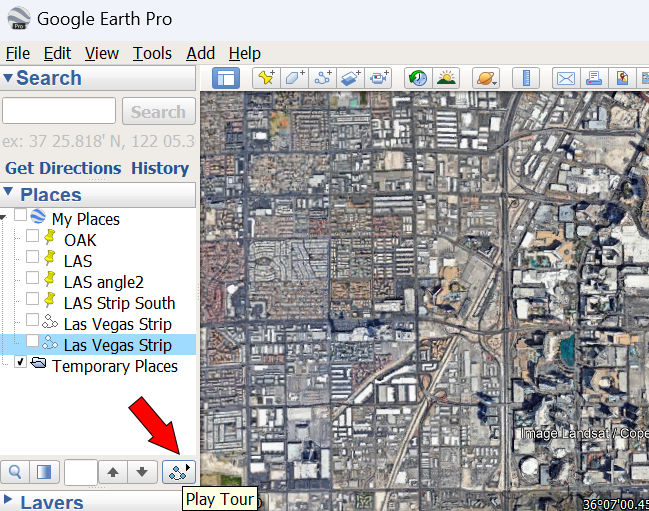
To play the path tour, just click the path Play Tour button, as shown below.
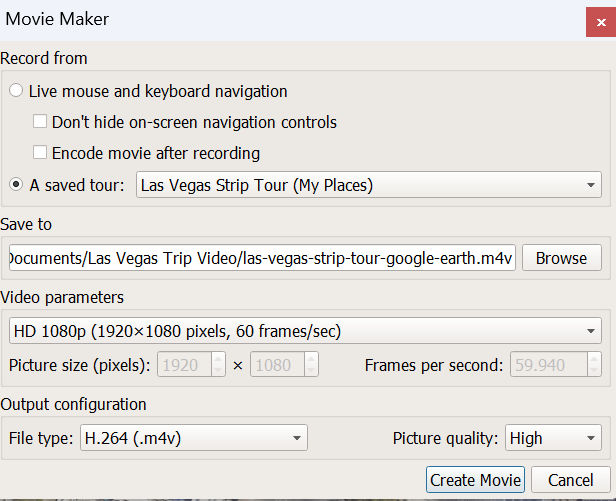
If you’re happy with how the tour looks, you can record it by clicking the “Record a Tour” button and then click the Play Tour button.
Then click Tools > Movie Maker to export the video.
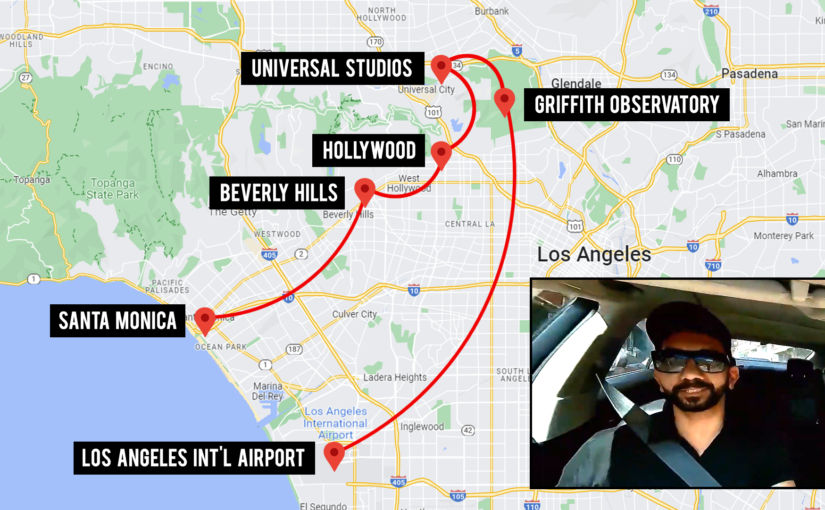
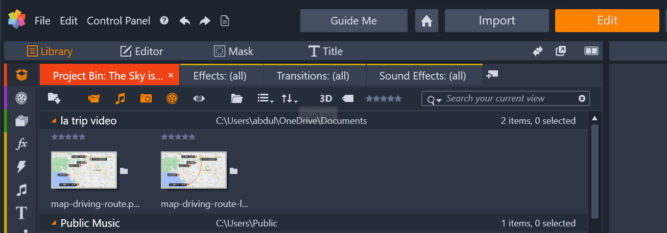
In this tutorial, I will explain how to create an animated travel map route from point A to point B using Pinnacle Studio.
1. Create two map images
We’re going to need to create 2 images.
an image without a route
an image with a route
This tutorial assumes you know how to create such images. I took a screenshot of Google Maps for the map background and used Photoshop to add balloon markers and location labels and to create the smooth route curves.
By default, the clips will be 3 seconds long. I prefer to drag them so they are 10 seconds long.
3. Create the animation
Drag the playhead to the beginning of the image clips
Double-click on the image on AV track 1
Click the “Effect” tab
Click the “2D-3D” tab
Double-click “2D Editor Advanced”
For “Select Preset”, choose “No Preset”
Scroll down. Under “Cropping, we’re going to edit the cropping properties as follows:
if the line will mostly animate toward the bottom, drag the Top % slider until the line first completely disappears.
if the line will mostly animate toward the top, drag the Bottom % slider until the line first completely disappears.
if the line will mostly animate toward the right, drag the Left % slider until the line first completely disappears.
if the line will mostly animate toward the left, drag the Right % slider until the line first completely disappears.
The clip in AV track 1 shows a black mask partially covering the image as you drag the slider.
Drag the slider, you’ll notice the line starts to disappear in the preview window.
Scroll back up in the 2D Editor Advanced pane and click on the diamond icon to turn on keyframing.
Drag the playhead to the point on the clip where you want the line to be finished. This will also change the speed of the “animation” as the cropping will go quicker if you end it earlier. I just dragged it to near the end of the clip.
Scroll back down and drag the slider to the left until the line first appears in full
Preview the animation in the preview window.
If the animation looks good, you can export it.
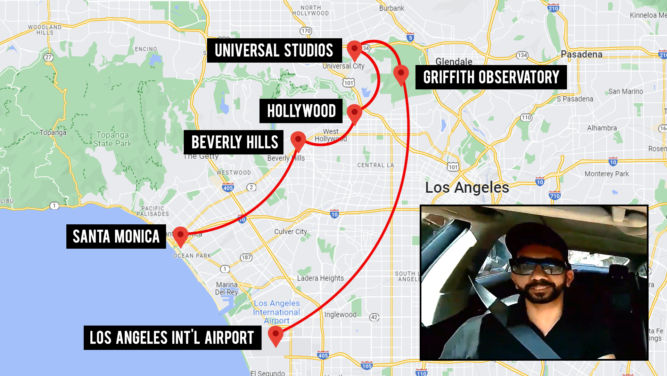
One idea is to partially overlay a video clip of you driving while describing your trip.
Another idea is to overlay the map route animation at 50% opacity over a video of the trip.
In the example above, I used the following two images.
sf-la-without-line.pngsf-la-with-line.png
To create the composite video, I used Corel VideoStudio and put the route animation video on an overlay track.
Double-clicking the overlay clip opens the clip’s settings. I clicked the “Blending” tab and then set the opacity to 50%.
I then had to slow down the speed of the route animation so its duration would be close to or match that of the airplane clips.
Right-click on the route animation clip
Speed > Speed/Time-lapse…
Change duration (in my case, I chose 20 seconds)
UPDATE
It’s actually easier to create the route animation on a Mac using Keynote. See these video tutorials.
Sometimes, you can download a YouTube video using a tool like YouTube-DLG or an online YouTube to MP4 converter. However, this doesn’t always work. One workaround is to use a screen recorder to record the video as it’s playing on YouTube in a browser. However, if you do this, then depending on various factors including the original video and your screen’s resolution, YouTube may show black bars around the video, like this
This tutorial for Windows will explain how to
screen record a YouTube video
resize the recorded video to remove the black bars
Screen Record a YouTube Video
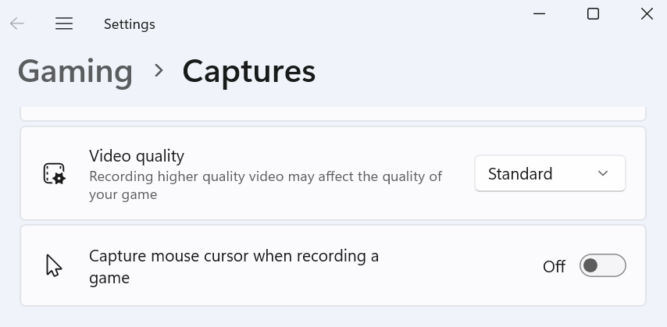
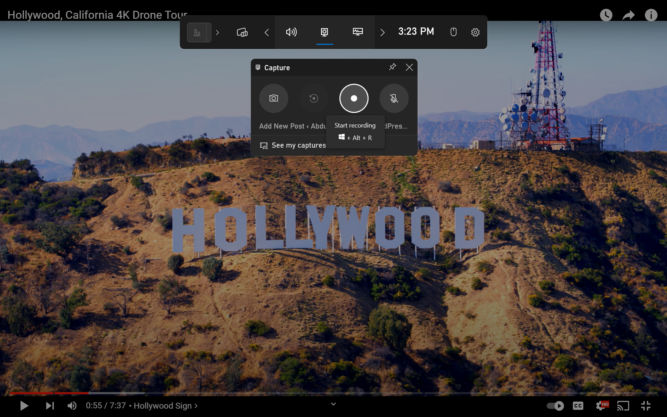
There are many tools you can use to record your screen. I’m going to use the Xbox Game Bar that comes included with Windows. We’ll need to update our video settings to not record the mouse cursor.
Open the Gaming > Captures settings and turn off “Capture mouse cursor when recording a game”
Open a browser, go to YouTube, and go to the video you want to record
Open Xbox Game Bar and click the record button
Play the video
Click to stop recording when you want to stop recording.
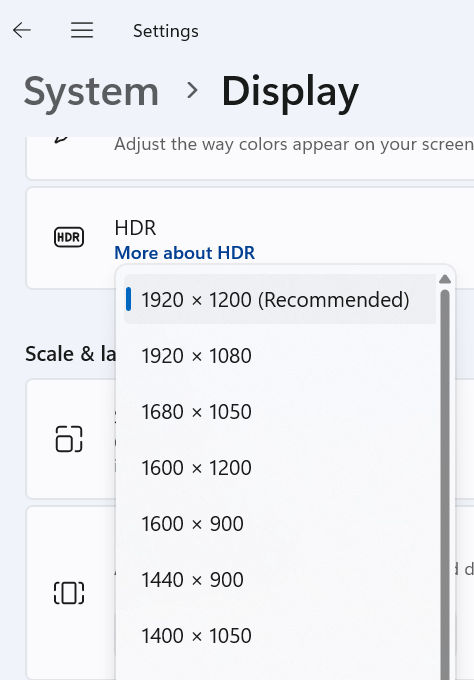
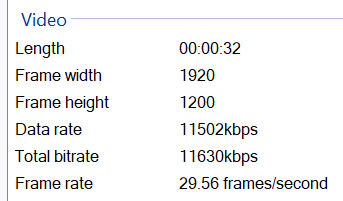
My screen resolution is set to 1920 x 1200.
Therefore, if you open the video recording’s properties, you’ll notice that the resolution is 1920 x 1200 instead of the standard 1920 x 1080 size for 1080p resolution. We’ll need to resize this and remove the black bars.
Resize a video and remove the black bars
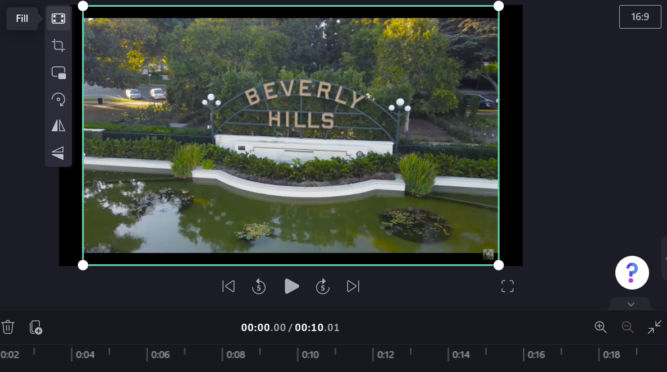
On Windows, open ClipChamp video editor
Import your video file
Drag it to the preview window
Make sure the aspect ratio is set to 16:9
Double-click the “Fill” icon
Notice how the video content fills the preview window and gets rid of the black bars.
Export the video (usually as 1080p).
NOTE: A simpler way is to temporarily change your screen’s resolution to match that of the video, e.g. 1920 x 1080, before recording the video.
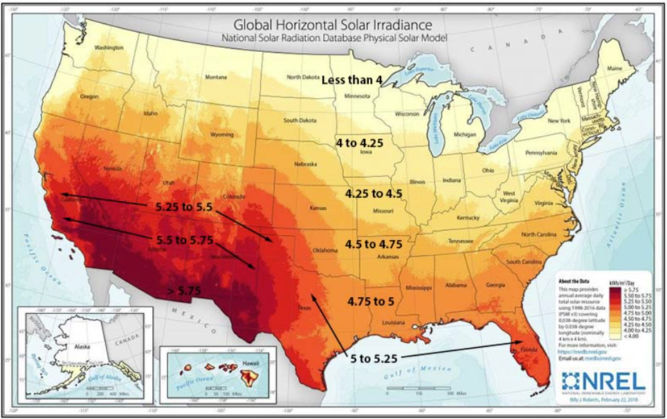
The information below is primarily for California. However, much of it still applies nationwide.
Interesting Fact
The sun essentially provides an endless supply of energy. In fact, with the amount of sunlight that hits the earth in 90 minutes, we could supply the entire world with electricity for a year — all we have to do is catch it!
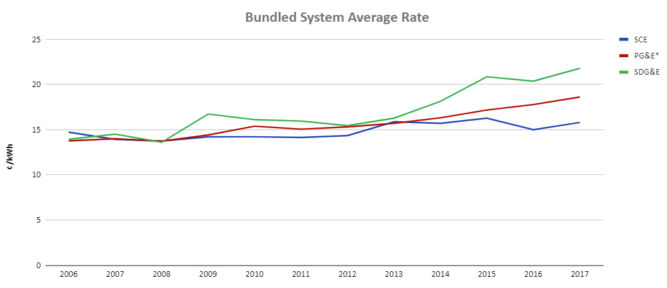
Seattle had the lowest price of any major metro area at $0.118 per kWh while San Diego, Houston, Urban Hawaii, and San Francisco all had electricity rates above $0.311 per kWh.
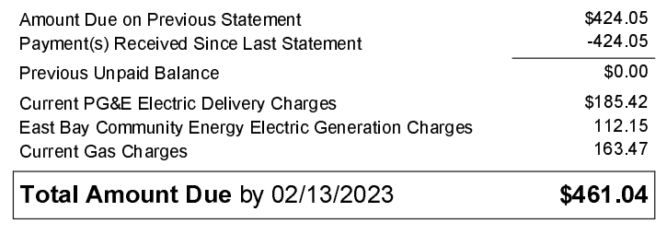
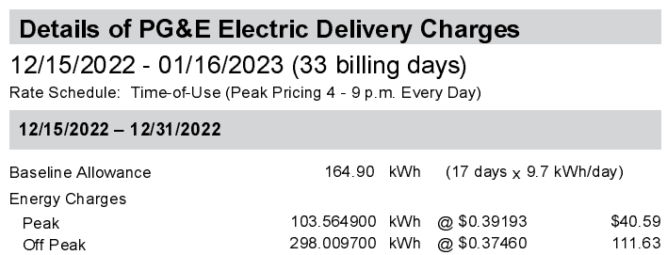
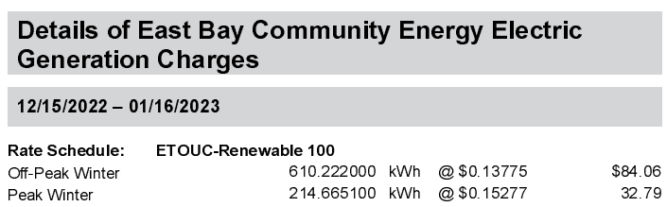
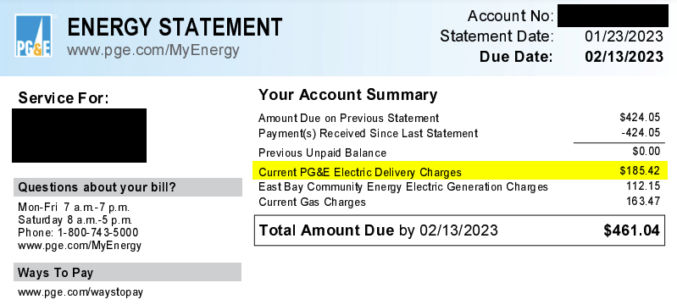
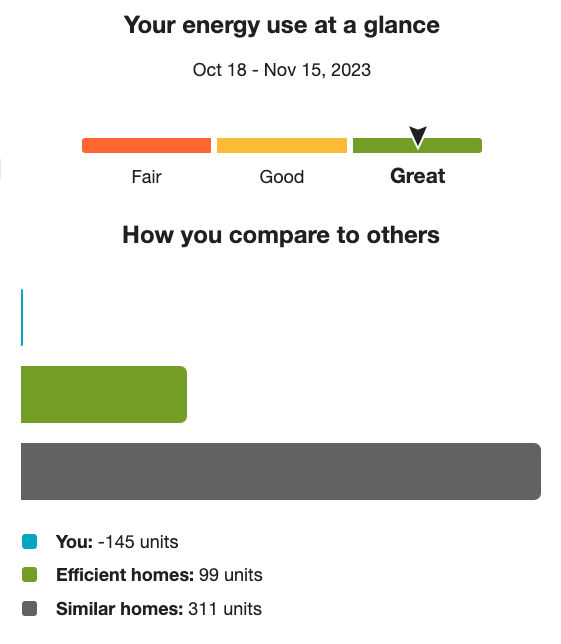
In January 2023, my PG&E energy bill was $461.04. The electricity portion alone was about $300. Looking at the bill below, the electricity portion is divided into two:
Delivery charges: This is the cost PG&E charges to just deliver electricity to my house.
Generation charges: This is the cost to generate electricity, e.g. by solar, wind, etc.
The delivery rate averages $0.38 / kWh.
The generation rate averages $0.14 / kWh.
The cost to deliver electricity is way more than the cost to generate it. Adding the two rates up, we get $0.38 + $0.14 = $0.52 / kWh.
According to the California Energy Commission, 66.4% of California’s energy comes from non-renewable sources and 33.6% comes from renewable sources. 14.2% comes from solar.
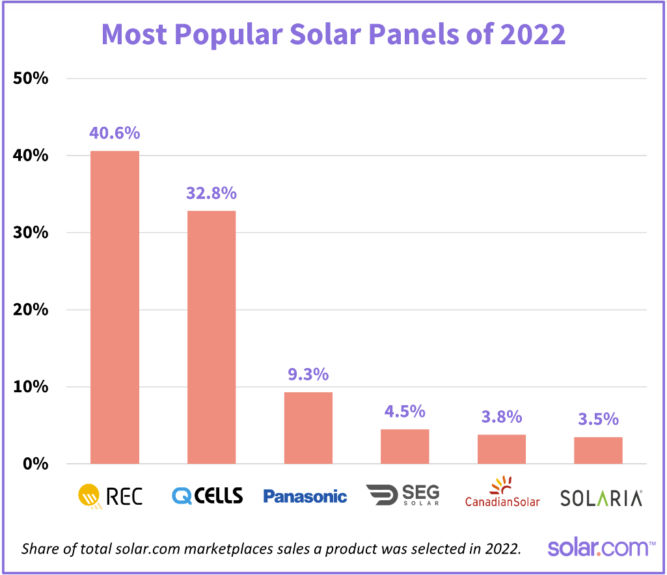
There are nearly 50 REC models and 80 Q CELLS models available through the solar.com network, ranging in wattage from 265W to 450W (although 400W is now considered the norm, and anything under 365W is considered rare).
REC and Q CELLS back their panels with a 25 year product warranty.
Best solar panels manufactured in the US
BRAND – HQ LOCATION
PANEL
MANUFACTURE LOCATION
WHY SOLAR.COM LIKES IT
Silfab – Canada
SIL Mono series
Bellingham, Washington
Durable, >20% efficient
Q Cells – Korea
Q. Peak Duo Series
Dalton, Georgia
Durable, >20% efficient
Mission Solar – US
MSE PERC series
San Antonio, Texas
Qualifies for Buy American Act
Solaria – US
Power XT series
Fremont, California
>20% efficient, superior shade performance
Best solar panels made overseas by US-based companies
BRAND – HQ LOCATION
PANEL
WHY SOLAR.COM LIKES IT
Sunpower – San Jose, CA
A-series
Up to 22.8% efficiency, 25-year warranty, built-in AC inverter
Sunpower – San Jose, CA
X-Series
Up to 22,7% efficient, extremely low degradation rate, 25-year warranty
SEG – Pleasanton, CA
SEG-410-BMD-HV
21.25% efficiency, 25-year warranty
Aptos Solar – Santa Clara, CA
DNA-120-MF26-370W
20.29% efficiency, durable, 30-year warranty
Top 3 solar panels by degration rate
PANEL
DEGRADATION RATE
PERFORMANCE WARRANTY
SunPower X-Series
0.2% to 0.25% per year
92% of minimum peak power after 25 years
Panasonic EverVolt® Photovoltaic series (EVPV)
No more than 0.25% per year
92% of maximum power after 25 years
REC Alpha series
No more than 0.25% per year
92% of nameplate power output after 25 years
Best solar panels for efficiency
Residential solar panels typically range between 15% and 20%, with the industry leading panels pushing 23%.
MANUFACTURER
MODEL
EFFICIENCY RATING
SunPower
A-series
Up to 22.8%
SunPower
X-series
Up to 22.7%
Panasonic
EverVolt® Photovoltaic series
Up to 22.2%
SunPower
M-series
Up to 22%
REC
Alpha series
Up to 21.9%
Silfab
Elite series
Up to 21.4%
SEG
SIV AC Module Series
Up to 21.25%
Silfab
X series
Up to 21.1%
Solar World
Sunmodule series
Up to 21.1%
S-Energy
SL40-60MCI-370
21.04%
Solar Panel Efficiency
There are a number of factors that influence solar panel efficiency. They include:
Temperature — Solar panels operate best in temperatures between 59 and 95 degrees Fahrenheit
Solar panels still generate electricity on cloudy days, although not as effectively as sunny days. Solar panels can capture both direct and indirect light (light that shines through clouds), but perform at around 10-25% of their normal efficiency when it’s cloudy.
Cloudy days can be beneficial, however, as rain washes the panels and increases their overall efficiency.
Color
If you’ll have solar panels that are visible, e.g. from the street, you may want to pick ones that look good. Most solar panel frames are anodized aluminum and come in silver or black. Choosing a black frame can enhance the look of your system greatly. You may be interested in getting “all black” panels, where the frame, backsheet, and cells are all the same black color.
Inverters
Most inverters have warranties ranging from anywhere between 5 and 10 years, though some can be extended to 25 years.
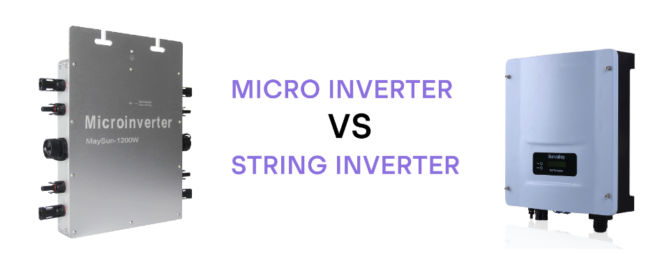
There are 2 types of inverters.
String inverter
Pros
Lowest cost
Standard inverter
Performs well with no shade
Cons
Overall production decreases if one panel is damaged or shaded
No ability to monitor each panel individually
Not optimal if your solar panels are facing different ways
Increasing power needs are more difficult and may require second central inverter installation
Microinverter
Pros
Shade from a nearby tree won’t reduce the whole solar panel system power output
Individual panel monitoring available
Increasing power needs are easier and less expensive than installing a second central inverter
Good for rooftops where solar panels may face different directions
Cons
Higher initial cost
Not necessary if all panels face the same way and are not shaded
Power Optimizers
Power optimizers can optimize the power before sending it to a central string inverter.
Pros
More efficient than string inverters
Less expensive than micro-inverters
Individual panel monitoring available
Cons
Higher initial cost
Not necessary if all panels face the same way and are not shaded
Solar Inverter Efficiency
Peak (max) efficiency and weighted (average) efficiency
Clipping/Scalping
If the solar panel DC output exceeds the max power rating of the inverter, the excess power is clipped (wasted).
It’s normal for the DC system size to be about 1.2x greater than the inverter system’s max AC power rating. For example, a 12 kW solar PV array paired with a 10 kW inverter is said to have a DC:AC ratio — or “Inverter Load Ratio” — of 1.2.
Solar Monitoring System
In order to ensure your solar system is producing energy normally, it’s important to make sure your solar panels are paired with an energy production monitoring system.
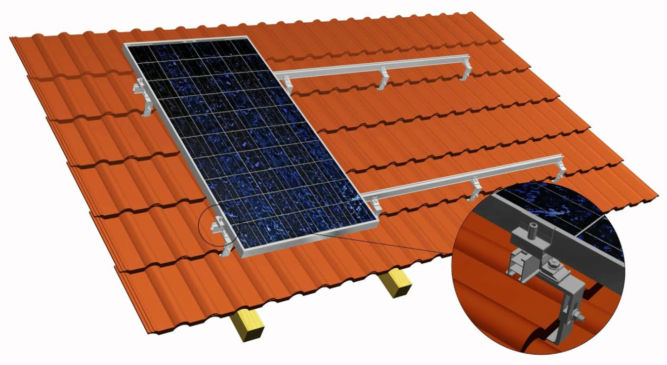
Solar Mounting and Racking System
It’s important to make sure your racking system, if roof-mounted, is properly flashed and sealed to ensure your roof is well-protected against the elements.
Roof Type
Roof Material
Note
Composite shingles
Most common roof material. Easy and cheap to install solar panels on them.
Clay Tiles
More expensive to install than all other roof types.
Concrete Tiles
Cheaper to install than clay tile roofs but more expensive than shingles.
Metal Standing Seam
Easy and cheap to install.
Tar and Gravel
More expensive to install than clay tiles.
Wood
Not recommended for installing solar panels
Warranties
Most major solar manufacturers including REC, SunPower, and Panasonic offer warranties that guarantee a certain level of output over 25 years, and some companies are beginning to offer 30-year warranties. The performance warranty guarantees that a panel’s output capacity will not drop by more than 0.7% per year, or less than 20% over 25 years.
Solar panels don’t disappear when they reach the end of their warranty, their production capacity just slowly degrades over time.
Solar Equation
The average energy needs of a U.S. household is a 6.62-kW solar system to match the 9,000 kWh of average energy usage by U.S. households each year. And, the typical solar panel makes 320 watts of electricity in ideal sunny conditions. Here’s how many solar panels that equals.
Divide 6.62 kW (the system size) by .320 kW (the wattage per panel) = 20.69—rounded up that’s 21 panels. While your home is far from average, this is how you can calculate your own rough estimate.
Solar Panel Wattage VS Efficiency
Solar panels are rated based on the watts they generate. The higher the wattage rating, the greater amount of power your solar installation will produce. Most residential solar panels have power output ratings from 250 to 400 watts, depending on panel size and how well they convert sunlight into energy. While higher power ratings are considered preferable, power output is not the sole factor in judging a solar panel’s performance.
For instance, two solar panels may each have a 15% efficiency rating, yet the power output rating of one is 250 watts and the other is 300 watts.4 The higher output may simply be due to the 300 watt panel’s larger physical size–rather than having a high efficiency or more advanced technology. Therefore, panel efficiency is a better indicator of solar panel performance than just power output for meeting your energy needs.
Incentives
The solar investment tax credit (ITC) is a 30% tax credit that you are allowed to claim in the form of a deduction from your income taxes (after any available rebates) off the overall gross system cost, including any necessary upgrades to the main panel box upgrades in order to go solar.
In August 2022, the Inflation Reduction Act increased the tax credit from 26% to 30% and extended it until 2032. It also renamed it the Residential Clean Energy Credit (although most people still call it the ITC or solar tax credit).
So if you purchased a solar system worth $25,000 in 2022, you can claim a $7,500 deduction on your 2022 taxes that you file in early 2023.
The new and improved solar tax credit also applies to battery storage, whether or not it’s connected to solar. So you can claim the tax credit for adding battery storage to an existing solar system or for battery storage that’s not connected to solar at all.
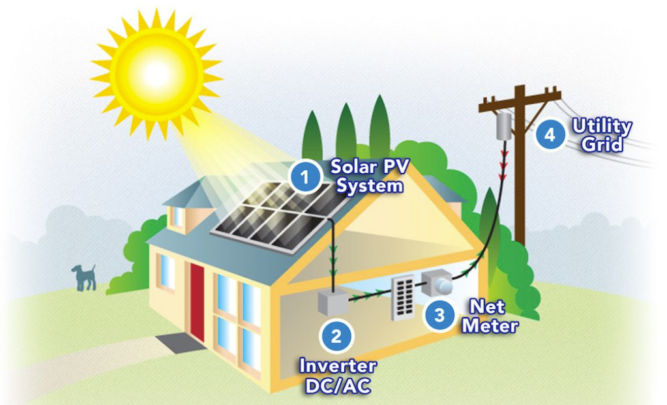
Net Energy Metering (NEM) is the policy that allows you to push and pull energy to and from the grid through your electrical meter. Traditional utility users pull energy from the main grid, use the energy in their home, and the meter counts how much is used. With solar, you will push your excess energy into the grid during the day and pull it out at night to use for lights, TV, A/Cm or anything else you may need. The grid functions as a bank storing your energy from your solar panels until you are ready to use it. With a battery backup system and secure power supply, you can use the energy from your system when the grid goes down.
Net Energy Metering Credits
If you don’t use all the energy your system produces in a day, that energy will roll over to the next day and so on. This happens day after day, month after month. This allows you to use all the energy you produce with your solar system. If you have higher usage months (AC, guests, holidays, etc) you draw from the extra energy credits you earned earlier in the year.
Solar True-Up
Once a year you “true up” with your utility where you settle the balance on your energy credit. If you consume more than you produce then you’ll pay the utility for the excess energy you pulled from the grid. If you produce more energy than you consume, the utility will compensate you for your excess energy at a below-retail rate.
NEM 1.0, 2.0 and 3.0
In most cases, 1 kWh of electricity pushed onto the grid offsets 1 kWh of electricity pulled off the grid.
However, energy utilities are making a nationwide push to weaken net metering by paying less than retail prices for solar exports. Most notably, California’s NEM 3.0 reduces the export rates by over 75%.
NEM 3.0 Final Decision: The California Public Utilities Commission (CPUC) unanimously voted to approve NEM 3.0. Under NEM 3.0, customers of PG&E, SCE, and SDG&E with solar systems will receive an average of 8 cents per kWh for the excess power they push onto the grid. This is roughly 75% less than the average export rate of 30 cents per kWh under NEM 2.0. IOU customers have until April 13, 2023 to grandfather a new solar system into NEM 2.0 by submitting a complete interconnection application.
NEM 3.0 key takeaways:
Current solar owners will remain under their existing net metering policy
Solar owners under NEM 3.0 will earn around 75% less for the excess electricity they push onto the grid
Under NEM 3.0, the payback period for solar and battery storage systems will be roughly equal to the payback period of solar only systems
Californians can be grandfathered into NEM 2.0 by submitting an Interconnection Application for a new solar system by April 13, 2023
Payback period and savings under NEM 2.0 vs NEM 3.0
Scenario 1: Cash purchase of an average 7.6 kW system with 100% offset
SOLAR UNDER NEM 2.0
SOLAR UNDER NEM 3.0
Monthly energy bill (previously $250)
$18
$96
Payback period
4.6 years
6.5 years
Lifetime savings
$116,680
$73,620
Scenario 2: 12-year loan for an average 7.6 kW system with 100% offset
SOLAR UNDER NEM 2.0
SOLAR UNDER NEM 3.0
Monthly energy bill (previously $250)
$162
$239
Down payment
$0
$0
Lifetime Savings
$110,308
$67,248
Scenario 2: 20-year loan for an average 7.6 kW system with 100% offset
There are two steps required to grandfather a solar system into NEM 2.0.
Submit a solar interconnection application to your utility before April 13, 2023
Install and receive permission to operate (PTO) within three years of submitting your interconnection application
Quick Note: NEM 3.0 is not retroactive. Existing solar systems will remain under their current net metering policy for 20 years from their interconnection date.
According to the final NEM 3.0 proposal, a valid solar interconnection application includes:
Complete application
Signed contract
Single-line diagram
CSLB Disclosure Document
Signed consumer protection guide
Oversizing attestations (if applicable)
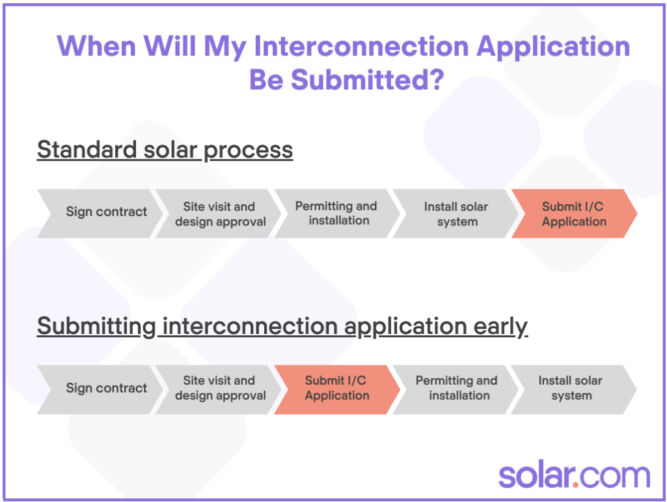
Typically, solar installers submit the interconnection application after the system has been installed. However, in response to NEM 3.0, many – but not all – companies are changing their operations process to submit as early as possible.
Since solar installations typically take 3-5 months to line up, it’s important to find an installer that has changed their process to submit interconnection applications early.
Beginning in January, you should be able to get emailed proof that you have been grandfathered within 2-3 weeks of signing the contract.
A 10-year study concluding in 2015 by the Lawrence Berkeley National Laboratory found that solar panels add around $4 per watt of capacity installed – or $4,000 per kW. Here’s how that adds up based on the size of your system:
SOLAR SYSTEM SIZE
INCREASE TO HOME VALUE FROM SOLAR PANELS*
4 kW
$16,000
5 kW
$20,000
6 kW
$24,000
8 kW
$32,000
10 kW
$40,000
Solar Installation Company
Factors to consider when choosing an installation company are
their number of installations,
their locations,
their bankability,
their online reviews,
their certification,
length of their workmanship warranty covering
roofing penetrations,
water damage,
electrical work, and
anything related to their installation for the time period described
Possess at least one year of installation experience
Solar Panel Maintenance
Solar PV systems require almost zero maintenance. Be wary of these ‘maintenance packages’ as they are often overpriced.
System Size
To determine the size of your solar system and the number of panels you’ll need, you need to know how much electricity you use on average per day.
Looking at my PG&E electricity usage and cost over the last 12 months below, we find that my average monthly electricity usage was 527 kWh. But, since I bought a plug-in hybrid and started charging my car in October, I’ll take my average to be from the last 3 months, which is 709 kWh. Of course, the last 3 months of the year were cold and daylight ended early at around 5 PM, so my electricity usage went up for other reasons as well. We’ll assume my average monthly electricity needs is 700 kWh and my annual usage would be 700 x 12 = 8400 kWh / year.
Start Date
End Date
kWh
Cost
Note
2022-01-18
2022-02-15
656.84
$168.47
2022-02-16
2022-03-17
577.84
$134.91
2022-03-18
2022-04-18
494.57
$102.54
2022-04-19
2022-05-17
358.42
$68.48
2022-05-18
2022-06-15
372.67
$82.26
2022-06-16
2022-07-17
443.17
$110.39
2022-07-18
2022-08-16
416.57
$103.91
2022-08-17
2022-09-15
452.3
$115.19
2022-09-16
2022-10-16
420.99
$94.50
2022-10-17
2022-11-15
604.61
$136.73
Includes charging EV
2022-11-16
2022-12-14
695.44
$162.45
Includes charging EV
2022-12-15
2023-01-16
824.89
$185.42
Includes charging EV
Average
Last 12 months
527 kWh
$122
Average
Last 3 months
709 kWh
$161
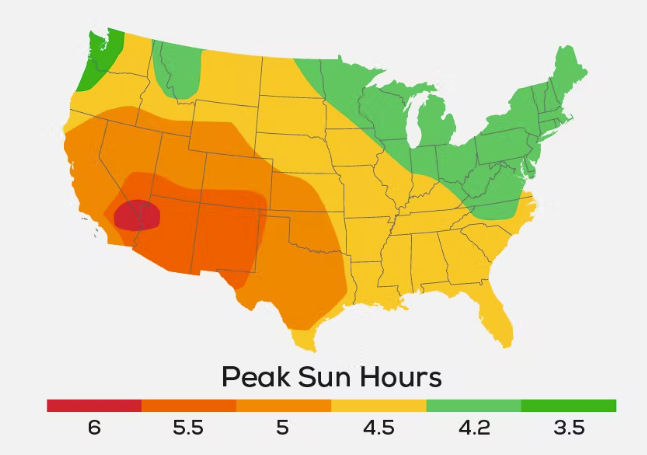
To continue this analysis, we’ll need the peak sunlight hours where I live. According to the map below, my peak sun hours is 5.
A
Monthly electricity usage
700 kWh / month
B
Daily electricity usage
24 kWh / day
A/30
C
Hourly electricity usage (kWh)
1 kWh / hour
B/24
E
Solar panel system output needed per day
5 kWh / day
F * peak sun hours (5)
So, the solar panel system size I would need is a 5 kW system. But, since solar panels don’t operate at maximum efficiency 24 hours a day, we’ll add a cushion of 25%. That brings the system size to 5 kW x 1.25 = 6.25 kW.
The average solar panel produces 400 W. So, the number of panels I would need is 6250 / 400 = 15.6 panels.
For a 6 kW size, I was quoted $25,820. If I apply the 30% federal tax credit, I’d get $7,746, which brings the effective cost to $18,074. Since the minimum lifetime of the solar system is 25 hours, then we can calculate the cost per kWh as $18,074 / 25 years / 365 days / 24 hours = $0.08 / kWh. That’s a lot cheaper than my current electricity rate of $0.52 / kWh (PG&E generation + delivery rate).
Since my monthly electricity needs are 700 kWh. Then we can compare costs as follows:
Cost / month
Cost / 25 years
Solar with 30% tax credit
700 kWh * $0.08
$56
$16,800
Grid
700 kWh * $52
$364
$109,200
As you can see, going solar saves a ton of money. And that doesn’t even include the rising cost of electricity from the grid, which averages 2.2% per year.
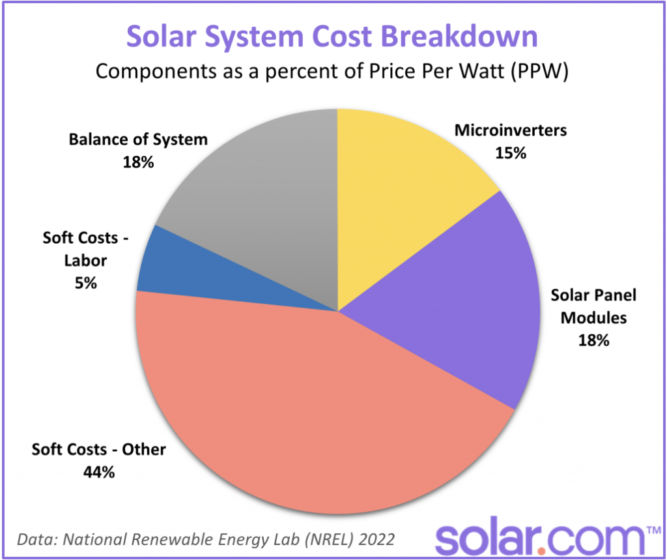
Cost Breakdown
Loans
“Same as cash” option
This means that the lender will fund the full amount of the loan, but only collect payments based on 70% of the outstanding balance during the first year or so. This amounts to a 30% discount on your payments for the first 12-18 months and makes Day One savings greater than on a traditional loan.
After the 12-18 months is over, the homeowner is expected to pay down the loan balance by the amount of the tax credit.
In the example used earlier, the homeowner would receive a $20,000 loan but only pay interest on $14,000. If at the end of the 12 month grace period the homeowner fails to pay back the tax credit amount, then the lender will start charging interest on the $6,000 portion from that point forward.
Combo Loan
Combo loans are independently financed. There are two separate loans.
The first loan is for 70% of the contract price, which has an interest rate (for which the homeowner qualifies). The second loan covers the remaining 30% of the contract price.
This second loan is meant to equal the federal tax credit amount and typically lasts for 18 months with 0% interest. If this amount is not paid off in that allotted time frame, the balance adopts the same APR as the first loan, whatever that may be.
Some lenders tout extremely low nominal rates (some as low as 1.89%). They don’t tell you is that there is something known as a ‘dealer fee’ that can run as high as 17%.
Make sure you check the following:
True APR
Monthly payments
No dealer fees
No prepayment penalty
Loan Term
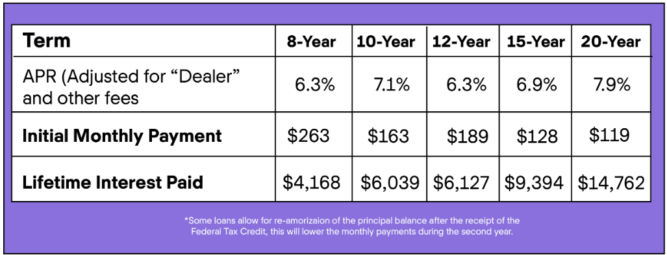
The table below compares monthly payments and lifetime interest paid for a $20,000 loan at different terms and APRs.
The most popular loan with Solar.com customers has a 12-year term, no pre-payment penalties, and interest rates of 2.99-4.99% depending on your credit score. The 12-year term is common because for most customers, their monthly loan payment is equal to or less than their current utility bill.
Sun Exposure
The more sun your solar panels get, the more money they can save you.
Comparison Shopping Checklist
Solar Panel
Brand
Type
Number of panels
Wattage per panel
Efficiency
Color
Warranty (fine print)
Company bankability
Solar System
Size (kW)
energy monitoring system
All-inclusive total cost (permits, materials, warranties, taxes, financing costs, etc)
Inverter
Type
Max power input
Peak efficiency
Weighted efficiency
Warranty (fine print)
Installation Company
number of installations,
their locations,
their bankability,
their online reviews,
their certification (NABCEP),
length of their workmanship warranty covering
roofing penetrations,
water damage,
electrical work, and
anything related to their installation for the time period described
do they guarantee minimum daily energy production?
NEM 2.0 Grandfathering
Is the company prepared to submit the documents needed for NEM 2 grandfathering early in the process?
Loan
Length of loan
True APR
Monthly payments
No dealer fees
No prepayment penalty
Update
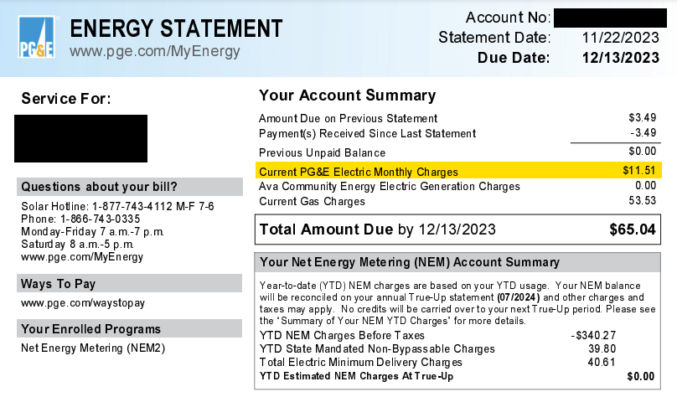
After installing solar panels, my electricity bill has gone down significantly.
There are many different ways you can edit home improvement videos. Here are some:
Make a Video From Photos
This is pretty simple to do. You can just add a bunch of photos to the video track of your video editor, animate each photo (many video editors can do this automatically), add some music to the music/audio track, and render the video. The result can be pretty good but it doesn’t really give a sense of the amount of effort or process involved. Here’s an example clip.
Regular 1x Speed Video
If you have a short video, leaving the speed at normal 1x speed might be okay. But, if your video is long, people will get bored very quickly. Since most home improvement projects take longer than 30 seconds, I don’t recommend this option, unless you are maybe adding a voiceover that explains what you are doing in the video.
Fast Speed (Timelapse) Video
Another option is to just timelapse the entire video. Some home improvement projects can take all day. Many people, including myself, will just leave a camera somewhere that will take many still photos at a set interval to create a timelapse video. You can also record an entire day’s worth of video, which I’ve also done using a WyzeCam mounted on a wall. Timelapsing an entire video is as easy as speeding up the video clip. The downside is the audio is also sped up and often doesn’t sound good so you usually mute the audio and optionally add some background music. Here’s an example.
Mixed-Speed Video
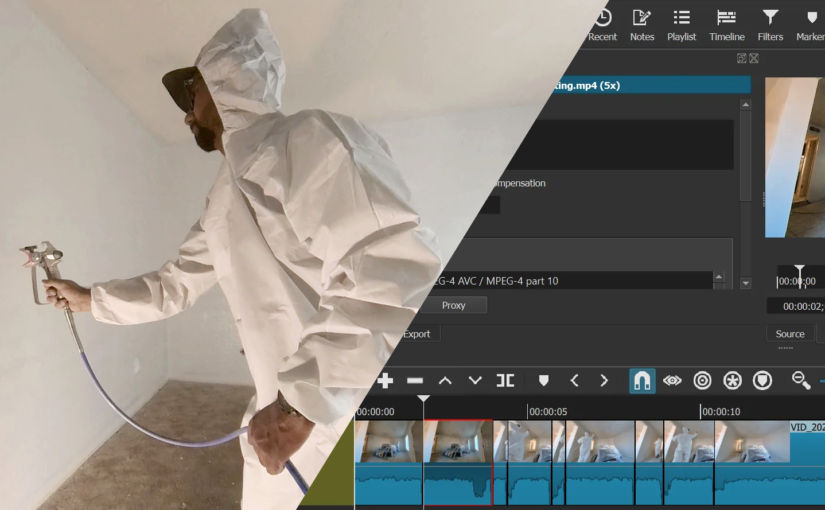
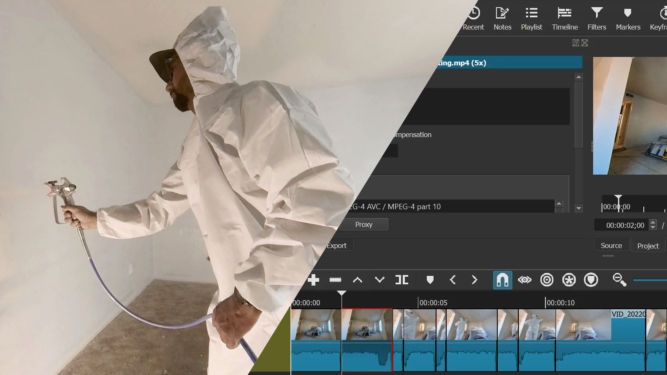
Another option is to timelapse (speed up) certain parts of the video and leave the other parts at regular 1x speed. This is definitely more work but I personally find this better than just speeding up the entire video. However, I find the best effect is when the regular speed segments are ones that have a high volume, e.g. when you’re using a tool that makes a lot of noise (drilling, jackhammering, cutting, etc). Here’s an example.
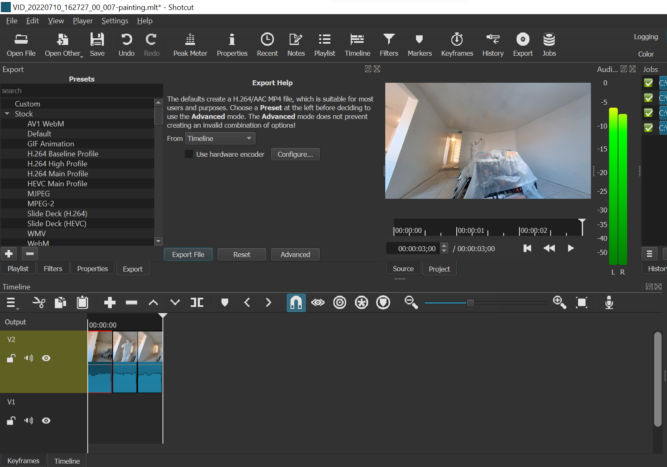
I normally use Corel VideoStudio to edit videos but for this purpose, I find Shotcut to be easier to use. Shotcut, which is free, shows the waveform very clearly, runs faster and hasn’t crashed on me yet. The UI takes some getting used to but once you get the hang of it, it’s pretty simple to us. Here are the steps I follow in Shotcut to create this type of video:
Open the original video in Shotcut
Drag it from the player to the timeline
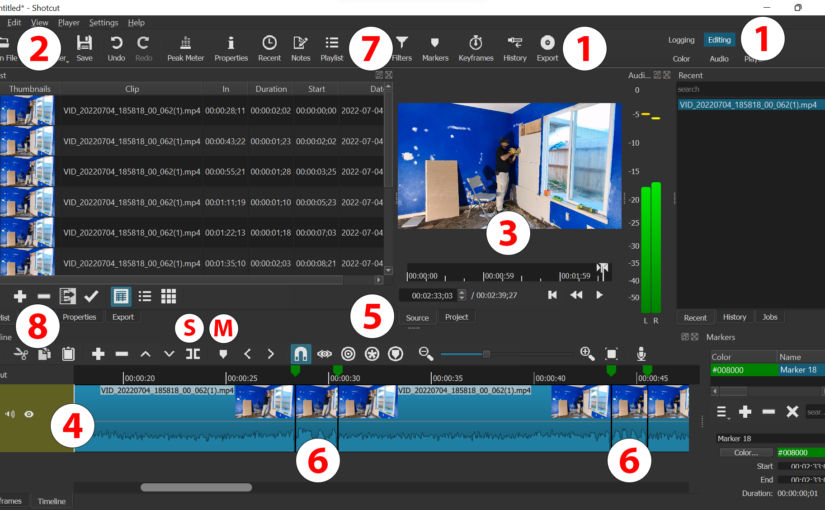
Zoom in, if necessary, so that you can see the audio waveform
Choose some or all segments where the waveform is high (high volume)
Scrub the playhead until you find a segment where the waveform is high (high volume) and the segment is interesting to show at 1x speed
Split the video at that playhead position.
Move the playhead by where you want to end the segment. For 1x speed segments, I choose a duration of 1 second. You can advance the playhead by 1 second by going to “Player” > “Forward One Second”.
Delete any segments you don’t want to keep (choose Ripple Delete to remove empty space as well)
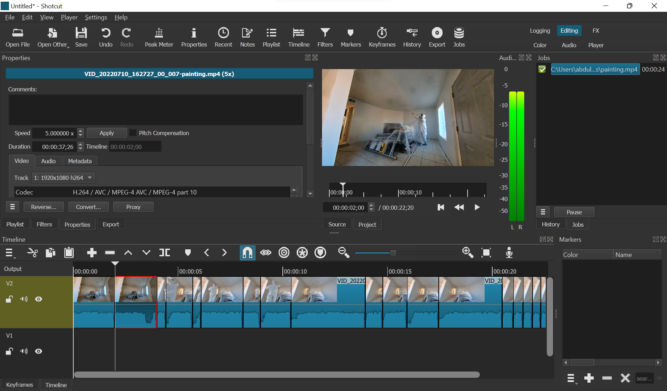
Click on a segment you want to speed up, click Properties, and change the speed. I choose 5x.
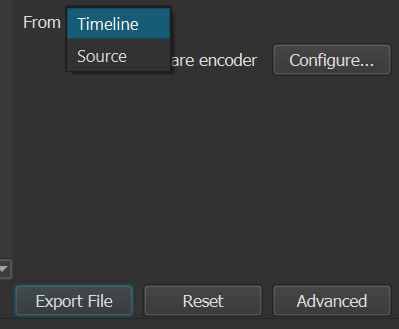
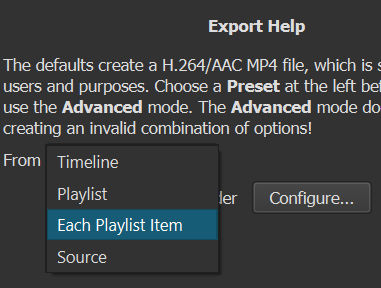
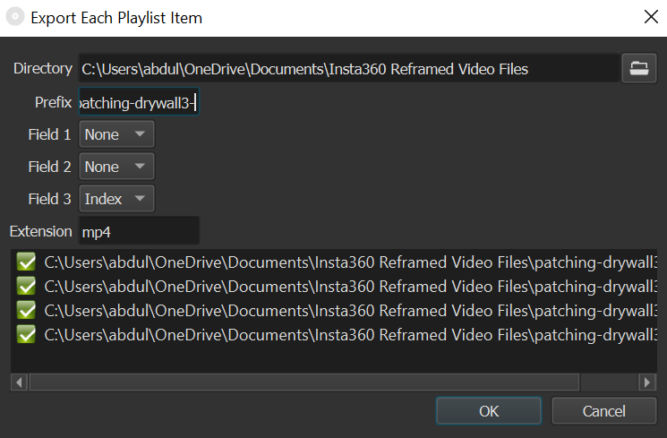
Click the Export button, select “Timeline” in the From field, and click “Export File”.
I changed the speed of this segment to 5x.
Video Showing Only Selection of 1-second Segments
Another option is to create a video from a selection of 1-second segments. Some segments will probably have high volume, e.g. drilling, jackhammering, cutting, etc. , Others may not, e.g. lifting, cleaning, drawing lines, etc. Again, I find this much easier to do in Shotcut than in Corel VideoStudio. Here’s an example.
Here’s how I do it in Shotcut:
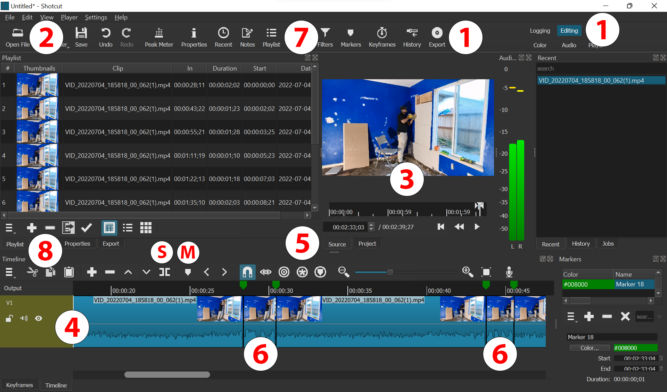
Open the original video in Shotcut
Drag it from the player to the timeline
Zoom in, if necessary, so that you can see the audio waveform
Scrub the playhead until you find an interesting segment
Split the video at that position
Move the playhead forward or backward by 1 second (“Player” > “Forward One Second” or “Backward One Second”.)
Split the video again to create a one-second clip
Repeat steps 4-7
Delete all other segments (choose Ripple Delete to remove empty space as well)
Click the Export button, select “Timeline” in the From field, and click “Export File”
I reduced this 3-minute long video to 3 seconds (each segment is 1-second long) where the volume was high.
Merging Clips
If you end up with a bunch of video clips that you want to merge and you don’t need to apply any transitions or effects, you can merge them almost instantly with LosslessCut.