There are many types of videos you can make to make money on YouTube, but arguably the easiest type is where you do nothing but walk around somewhere interesting. For example, here are a few YouTube channels dedicated to walking tours.
According to SocialBlade, their estimated monthly earnings is between $157 and $2.5K and their estimated annual earnings is between $1.9K and $30.1K. We can also see their estimated earnings for each video.
Let’s check another channel’s estimated revenue.
@t0urister
This channel makes between $634 and $10.1K per month and between $7.6K and $121.8K per year. With this type of income, you can quit your job and literally just walk around to make a living (plus some minor video editing).
Camera
If you want to start your own YouTube walking tour channel, you’re going to need a camera. One of the cheapest and smallest cameras with impressive features for its price range is the DJI Osmo Pocket 3.
If you don’t want to hold the camera in your hand, you can mount it on your chest or a backpack strap for hands-free filming.
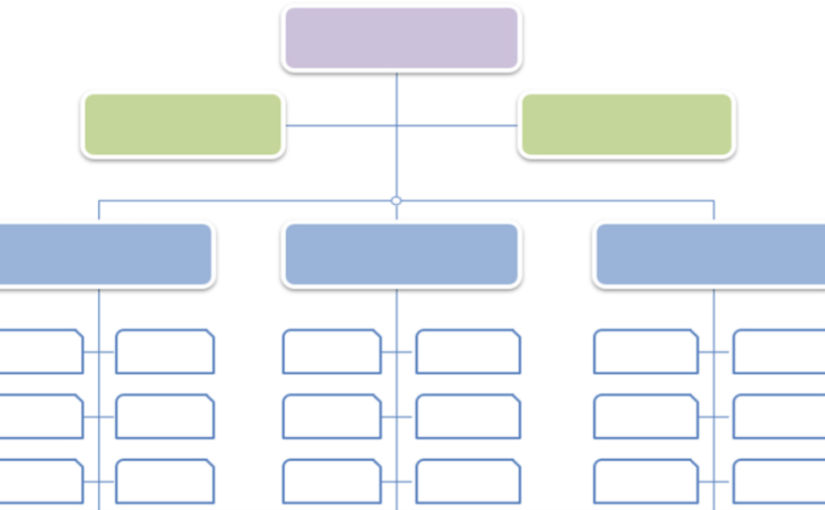
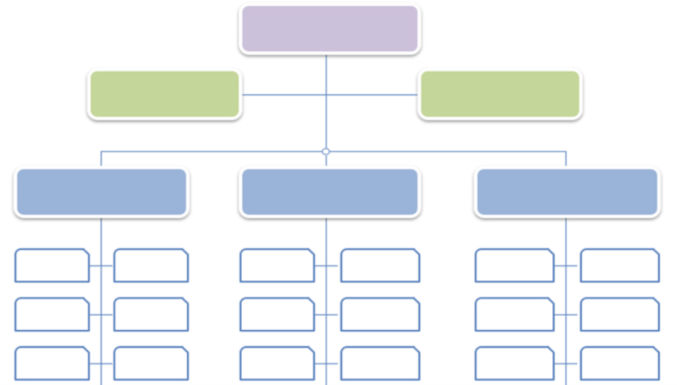
In my 12 years working in Marketing, I’ve see a few different organizational structures at both low and high levels. And in my particular role, I’ve had to work with pretty much everyone, which has given me exposure to many issues that often go unnoticed. While there are many ways you can structure an organization, whatever way you come up should always make sense based on your particular organization’s needs. Following is a structure that I think makes sense based on my experience. The specific job titles (chief, VP, director, manager, senior vs junior, etc) are just an example. The important thing is that the structure and hierarchy groups people by function, commonality and importance. The structure below is for a 2000+ employee organization. Obviously, if your organization is much smaller or larger and has more or less dependencies on particular functions, some positions and groups can be removed or consolidated or even divided and expanded.
Level 1:
CMO (Chief Marketing Officer) or CPO (Chief Product Officer)
Level 2:
VP of Marketing
VP of Product
Level 3 and 4
Director of Content (or similar name)
This functional group primarily deals with marketing activities that involve text content. Since a big part of SEO involves text content, I put SEO Expert in this group.
Public Relations Expert(s)
Copyediting Expert(s)
Proofreading Expert(s)
SEO Expert(s)
Social Media Expert(s)
etc
Director of Design (or similar name, e.g. creative, etc)
This functional group primarily deals with marketing activities that involve visual design. Brand has to do with a company’s external public image, which relates to both public relations and design. Depending on your preference, this role could be under this “design” group or the “content” group above.
Graphic Designer Expert(s)
Web Designer Expert(s)
Brand Expert(s)
Video Expert(s)
UI / UX Expert(s)
etc
Director of Web (or similar name)
This functional group primarily deals with marketing activities that involve websites. Due to the criticality and complexity of today’s websites, significant dependencies that all functional groups often have on a company’s website, and unique technical skills that members of this group have, I made this group a standalone group rather than a subset of another group. Also, since email marketing is very effective, and because HTML emails contain code like that used on a website, I put HTML Email Expert(s) in this group. Though many marketing automation tools like Marketo include an email builder tool, I’ve found that they are limited in features and produce emails that don’t look professional unless the user has web development skills.
HTML, CSS Expert(s)
JavaScript Expert(s)
WordPress Expert(s)
HTML Email Expert(s)
etc
Director of Marketing Operations (or similar name)
This functional group primarily deals with marketing activities that involve marketing automation tools like Marketo, revenue attribution tools like Bizible, data analysis and reporting tools like Tableau and Google Analytics, customer relationship management tools like Salesforce, lead processing and routing, etc.
Marketing Automation, e.g. Marketo Expert(s)
Customer Relationship Management (CRM), e.g. Salesforce, Experts
Reporting and Data Analysis Expert(s)
etc
Director of Channel Marketing (or similar name, e.g. demand generation)
This functional group primarily deals with marketing activities that fall under certain channels like events, e g. virtual or in-person conferences, partner marketing, etc, and demand generation activities like advertising campaigns such as Google Pay Per Click (PPC), email marketing, digital media marketing, print advertising, etc.
Event & Event Marketing Expert(s)
Partner Marketing Experts(s)
Google PPC Expert(s)
Campaigns Expert(s)
etc
Director of Product (or similar name)
This functional group primarily deals with product management and product-specific marketing. For example, many tech companies have multiple products. Each product requires a specific subject matter expert, as it may be uncommon to find someone who is an expert in multiple products. Each product expert (commonly called “product manager”) basically is responsible for their own product, from understanding their product’s customers’ needs, making product feature decisions, helping market a product, e.g. by writing product page content, product-related blog posts, giving product-related webinars, etc.
Product Expert for Product A
Product Marketing Expert for Product A
Product Expert for Product B
Product Marketing Expert for Product B
etc
Project Manager
There is one role that doesn’t quite fit in any of the categories above. Needless to say, many marketing activities require the collaboration of multiple functional groups, but each of these groups specialize in their own areas. There’s no such thing as a person or group who specializes (or is even interested) in everything. One big issue I often see is how certain marketing activities with a specific hard deadline, e.g. due to an earnings release or predetermined and pre-marketed event taking place, results in chaos, with many people working nights and weekends due to lack of planning, ownership and project management. That’s why there’s a particular title called Project Manager (PM) or Project Management Professional (PMP) and a certification where people can get a PMP certificate. These people don’t specialize in the various components that go into a project, but rather they keep a project on track to avoid delays, mistakes, oversight, etc. Sometimes, they have the boring task of having to keep reminding people to do their part to avoid delays caused by blocking subsequent tasks. Assigning a random person to be a temporary project manager may work for small projects involving few people, but for large projects involving many people, a “real” project manager who actually specializes in project management is needed.
Title Hierarchy
Here’s a title hierarchy commonly used in many companies.
Capital gains is the profit you make from selling a capital asset.
Capital assets include stocks, bonds, precious metals, jewelry, art, and real estate.
Selling a capital asset after owning it for one year or less results in a short-term capital gain.
Selling a capital asset after owning it for more than one year results in a long-term capital gain.
Net capital gains are calculated based on your adjusted basis in an asset. This is the amount that you paid to acquire the asset, less depreciation, plus any costs that you incurred during the sale of the asset and the costs of any improvements that you made.
Short-term capital gains are taxed as ordinary income from your salary or wages.
Long-term capital gains are subject to a tax of 0%, 15%, or 20% (depending on your income).
Short-Term Capital Gains Tax Rates By Income (2023)
Filing status = single
Income
Short-Term Tax Rate (same as ordinary income tax rate)
Up to $11,000
10%
$11,000+ to $44,725
12%
$44,725+ to $95,375
22%
$95,375+ to $182,100
24%
$182,100+ to $231,250
32%
$231,250+ to $578,125
35%
Over $578,125
37%
Filing status = married filing jointly
Income
Short-Term Tax Rate (same as ordinary income tax rate)
Long-Term Capital Gains Tax Rates By Income (2023)
Filing status = single
Income
Long-Term Tax Rate
Up to $44,625
0%
$44,626 to $492,300
15%
Over $492,300
20%
Filing status = married filing jointly
Income
Long-Term Tax Rate
Up to $89,250
0%
$89,251 to $553,850
15%
Over $553,850
20%
Taxable Income
Taxable income is the portion of your gross income that the IRS deems subject to taxes.
It consists of both earned income and unearned income.
Taxable income is generally less than adjusted gross income because of deductions that reduce it.
Taxable income = Gross income – deductions
For a business, revenue – business expenses = profit. Profit – deductions = taxable income.
Deductions
The IRS offers individual tax filers the option to claim the standard deduction or a list of itemized deductions.
Standard Deduction
The standard deduction is a set amount that tax filers can claim if they don’t have enough itemized deductions to claim. For the 2022 tax year, individual tax filers can claim a $12,950 standard deduction ($13,850 for 2023). If you are married filing jointly, the standard deduction is $25,900 ($27,700 for 2023).
Itemized Deductions
If you plan to itemize deductions rather than take the standard deduction, these are the records most commonly needed:
Property taxes and mortgage interest paid (form 1098)
State and local taxes paid (this is on form W-2 if you work for an employer)
Charitable donations
Educational expenses
Unreimbursed medical bills
Documents related to operating a rental property, such as receipts for repairs, advertising, etc. Learn more.
A tax credit will lower your tax liability (any taxes you owe). If you don’t owe any taxes, then you may or may not get a refund, depending on the tax credit details. Some tax credit examples are
30% credit off the total cost of a solar panel installation
$7,500 tax credit when you buy a qualifying electric vehicle
Refundable tax credit: If your tax credit is refundable, then even if you have no tax liability, e.g. if you are retired, then you will still get a refund for the entire tax credit amount.
Non-refundable tax credit: If your tax credit is non-refundable, then you will only get the full credit if your tax liability is at least as much as the tax credit. For example, if your tax credit is $1000 and your total tax liability before applying the credit is $1500, then your updated tax liability is reduced to $500. However, if your total tax liability before applying the credit is $800, then your updated tax liability is reduced to $0 and you will NOT get a refund for $200. For that reason, you should ensure your tax liability is at least as much as the tax credit you want to apply.
How to Calculate Taxable Income
Determine Your Filing Status
single,
married filing jointly,
etc
Gather Documents for all Sources of Income
form W-2 for earned compensation
form 1099-INT for interest income
etc
Calculate Your Adjusted Gross Income (AGI) Your AGI is the result of taking certain “above-the-line” adjustments to your gross income, such as contributions to a qualifying individual retirement account (IRA), student loan interest, and certain education expenses. These items are referred to as “above the line” because they reduce your income before taking any allowable itemized deductions or standard deductions.
Calculate Your Deductions (Standard or Itemized)
Calculate Taxable Income Taxable income = AGI – deductions
Marginal vs. Effective Tax Rates
The US has a progressive tax system, so your income is taxed at different rates. If your total annual income is $125,000 and your taxable income is $100,000 (income minus deductions and credits) and you are filing single, your tax liability would not be 24% of the entire $100,000. Instead, it would be $17,400. In this case, your “effective” or “average” tax rate is $17,400/$125,000 = 13.9%, which is much lower than 24%.
According to RocketMortgage, the average mortgage term is 30 years and the average length is under 10 years. This is because homeowners will either refinance their home, like I did to get a much lower interest rate, or because they want to move. Refinancing your mortgage to get a lower interest rate makes sense if the new rate will be much lower such that you’ll end up saving money. You’ll just have to keep in mind that if you’ve had your mortgage for 10 years, for example, and you refinance, the clock resets and you’ll have 30 years to pay off your mortgage instead of 20. For this reason, I personally continue to pay the same monthly payments at the higher interest rate so that I pay less interest and the mortgage is paid off sooner.
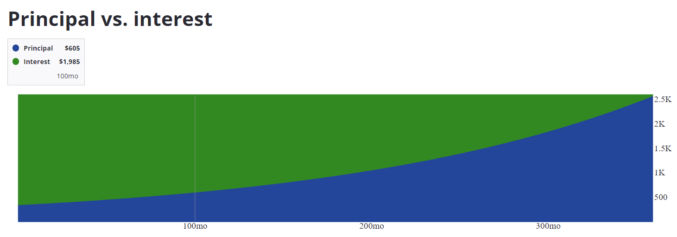
But what if you sell your home to buy a new one within 10 years? What many people may not realize is that by doing this, they will lose a lot of money because their home loan is an amortized loan rather than a simple interest loan. Amortized loans favor lenders, like banks, instead of borrowers. Unlike a simple interest loan, where you’re paying the same amount towards principal and interest each month, when you get a mortgage, most of your monthly payments go towards interest in the beginning and less near the end of the 30-year term.
Note that your total interest payments over 30 years is more than the loan amount.
Let’s take a few points in time and compare how much of your monthly payment goes towards principal and interest.
Principal
Interest
Percent Towards Interest
First mortgage payment
$346
$2244
86.64%
Mortgage payment at month 100 (8.3 years)
$605
$1985
76.64%
Mortgage payment at month 200 (16.7 years)
$1058
$1531
59.13%
Mortgage payment at month 236 (19.7 years)
$1294
$1295
50%
Mortgage payment at month 300 (25 years)
$1851
$738
28.51%
Mortgage payment at month 360 (30 years)
$2578
$14
0.54%
As you can see, in the first 10 years of your mortgage, the bulk of your monthly payments goes towards paying interest. Your equity from paying down the principal is very little. Therefore, if you sell your house within the first 10 years and buy a new one, you’ll have little equity from your mortgage payments and, when you get a new mortgage for your new home, you’ll start over from month 1, when most of your new monthly payments will go towards interest again.
Of course, your house could appreciate significantly in 10 years, in which case the equity you gain from appreciation could outweigh the equity from paying off the principal. However, that is not always the case.
If you’re planning on selling your home within 10 years and buying a new one, it may not be worth it since you may lose a lot of money from having mostly just paid interest.
I just finished reading the book No Rules Rules: Netflix and the Culture of Reinvention by Reed Hastings, co-founder and former CEO of Netflix, and Erin Meyer. It’s an extremely popular book, based on its ratings. Since I didn’t have time to read the full 320-page book, I read the 7-page summary on Blinkist. I can see why so many people like it. This book is most definitely required reading for anyone managing teams in a company. In fact, the higher you are in the org chart, the more you should read this book!
As everyone probably knows, Netflix is the wildly successful online film streaming service where people can watch movies, documentaries, TV series, and more. Its success can be attributed to many things including its ability to nimbly pivot. It started as a DVD-by-mail subscription service, then transitioned to an online streaming service. It then began licensing original content produced by other studios, and finally, it started producing its own in-house movies and TV shows. In the beginning, it was 1000 times smaller than brick-and-mortar video rental store Blockbuster yet managed to put Blockbuster out of business some 10 years later. Netflix grew 300 times faster than the NASDAQ stock index over 17 years, and a 2018 survey rated it the top place to work in Silicon Valley.
Here are the key takeaways from the book.
1: High talent density encourages employees to perform at their very best
Companies should focus on hiring and retaining highly talented people. To do so, they need to pay rock-star salaries. High performers thrive in an environment with other high performers, and this environment attracts other high performers and holds people to a higher standard. When everyone is excellent, performance skyrockets.
2. Radical candor helps Netflix employees improve, even if it can be difficult to hear
Radical candor is a vital part of Netflix’s company culture. It’s perfectly normal for people to directly contradict their bosses in meetings if they disagree with something. In fact, employees are expected to disagree. If you don’t, it’s as if you are purposely being disloyal to the company. You could help the business improve, but you’re choosing not to.
Unlike at most companies, where there’s just one annual performance review that is top-down, at Netflix, employees are encouraged to give feedback at all times. And, more importantly, they are encouraged to give feedback to their bosses, even more so than the other way around. This is very unconventional, but it actually makes a lot of sense, because the higher you are in an organization, the more likely you are to make a mistake that seriously impacts the company.
There are 4 rules to candor to make it effective:
give feedback with the aim of helping.
your feedback should be actionable.
when receiving feedback, you should appreciate the effort and bravery of your colleague in speaking up.
you should think carefully about whether or not to accept it.
3. Getting rid of useless policies made Netflix employees more accountable
Micromanaging is a waste of people’s time as is requiring employees to follow useless policies. Giving employees more freedom promotes accountability. It signals that you trust them.
4. Maintaining a talent-dense team requires a lot of intense effort.
A lot of companies talk about how their employees are a family. I’d often read new employee introduction emails where they’d say they’re excited to join the company’s family. At Netflix, they don’t consider their talent-dense team like family because they don’t believe that a particular job is something you should have for life regardless of your performance. Instead, they believe a job is something you do for a particular period of time when you’re the best person for that job and the job is the best position for you. Netflix employees are more like a professional sports team of highly talented people rather than a family of people with varying degrees of talent.
To maintain talent density, you have to do something unpleasant: fire people who are merely adequate. To minimize having to do this, it makes sense to put more effort into testing and interviewing candidates. Since firing people can’t impact their personal finances and morale, Netflix offers generous severance packages. An individual contributor gets four months’ pay, and a VP gets nine months.
5. At talent-dense organizations, dispersed decision-making is most efficient.
At most companies, the boss is there to either approve or shut down employees’ ideas. That’s leadership with control. This is a great way to limit innovation and slow down growth.
At Netflix, managers lead with context, letting employees use their own judgment to make the choice they feel is best for the company. With employees making their own decisions, senior leadership is freed up for other things.
I’ve worked with people at all levels of an organization and have seen people make costly, long-lasting mistakes. After a while, it’s hard to not notice a pattern, especially when some of the mistakes affect you. If you stop to think about these mistakes and their root cause, you’ll realize that they could have easily been avoided by following common sense and business best practices. Following are some of the common mistakes I’ve seen that have the potential to have costly, long-term detrimental effects.
Poor Hiring
Successful business leaders and venture capitalists (VCs) know this all too well. What makes or breaks a company is its people, especially the management team. Sadly, I’ve seen many people, including high-ranking executives, make obvious mistakes when interviewing candidates and hiring people. Some of these mistakes include:
Hiring a full-time employee without having a full-time amount of work for them
Asking completely irrelevant, high-ranking employees to interview a candidate
Not having certain employees interview a candidate who they’ll have to work very closely with just because they are low-ranking employees
Judging a candidate based solely on their resume and a short, verbal interview
Writing vague job descriptions and not setting correct expectations up front
Not testing a candidate
Some examples are
Having a director of public relations instead of a web developer interview a web designer candidate
Not having a web developer interview a director of content, even though they’d be working together on a daily basis
Not testing a copywriter or proofreader to write an essay or proofread a blog post
Hiring a director of content marketing to own content but not confirm their ability and interest in performing certain content-related tasks, e.g. writing and proofreading content.
Personal experience being interviewed
When I’ve interviewed at some companies, sometimes I’d be tested. I’ve had to write some code at home and sometimes I’ve had to answer a series of technical questions in real time. I’ve even had to give a presentation in front of a group of 10 or 15 people and write code on a whiteboard. As much as I didn’t like doing this, it made sense for the company to request it.
Testing candidates
When I posted a job ad to hire a web developer in India, I was inundated with applications. Since hiring a skilled and competent employee will make my life easier and make me look good, I spent extra time finding the best candidate available. I first shortlisted the resumes and then ranked each one based on their resume. My recruiter set up meetings with each one in order of ranking. I wrote a series of technical and non-technical questions to ask each candidate. That made the interview process very structured and methodical. It also was fair and made it easy for me to compare each candidate. Based on their verbal answers, I shortlisted them and gave a take-home coding test to the top 3. Each candidate was given 3 or so days to complete the test. Before reviewing each test, my impression was that all candidates were more or less equal in skill. After reviewing their tests, the first candidate failed horribly. The second candidate wrote overly complicated code and made some obvious mistakes. The third candidate wrote simple, clear code and only had very minor mistakes. I hired the third candidate and haven’t regretted doing so ever since. This experience goes to show that a candidate may look good on paper, but fail miserably in practice.
Reviewing sample work
In another situation, I needed to hire a proofreader to review various kinds of content, including product pages, blog posts, emails, etc. I didn’t need a full-time person, so I sought a freelancer on a pay-per-project basis. A seasoned writer was referred to me. When I saw her sample articles, each one contained some obvious typos. This was a red flag since a simple spell checker would have caught them. I did not bother to proceed with the referral. On another occasion, a resume was forwarded to me. Ironically, the candidate’s resume itself was full of typos, so there was no point in proceeding with that candidate either. Surprisingly, hiring managers don’t always look at these signs and are just overly optimistic and hopeful that the candidates will just perform well.
Not all candidates can be tested or may have a portfolio of sample work, but with some creativity, you can probably find a way to gauge their abilities to meet your needs and expectations to fill a particular job besides just looking at their resume and interviewing them.
Unvalidated Decision-Making
Every now and then, I come across some employee who makes a decision based on tradition or assumptions rather than data or subject-matter-expert consultation. It requires no explanation why the latter is better. Here are some examples.
Not making decisions based on data
Someone wants to update the top-level navigation of a website to include a link to their department’s website, e.g. training, support, documentation, blog, videos, etc. They know that their department’s website is accessible from the 2nd-level navigation and from many other places on the website. However, they insist on being at the top level. They don’t bother to ask for website page traffic data to see how many people even visit their section of the website to justify their change request. According to a year’s worth of Google Analytics data, it turns out that only a small fraction of people visit their website. In this case, putting a link to their website at the top-level navigation would not be a smart decision.
Not asking subject matter experts
An executive hears from the website manager that the website is custom-coded by a handful of web developers. Sometime later, the executive hears complaints from marketing campaign stakeholders that it takes too long to create website landing pages. He assumes that the delays are because the pages are custom-coded. He becomes obsessed with migrating the website to a content management system (CMS). He sees an ad for a CMS that claims it can make website updates a breeze. He then embarks on an expensive project to migrate the website to a CMS without realizing that the root cause of the delays had nothing to do with how the pages were built. Had the executive asked the subject matter experts (in this case, the website manager), he would have learned that the delays were caused by the backend integration with other systems, e.g. Marketo and Salesforce, and by the time difference between teams in different countries. In this case, the executive made a bad decision based on assumption, even though the answer to his concerns was a simple email or phone call away.
Quantity Over Quality
Most of the time, quality is more effective than quantity. For example, you can publish many poorly written blog posts and landing pages that get no views, or you can publish a few strategically written ones that go viral. Another example is creating a bunch of paid social marketing campaigns with plain graphics and rushed messaging only to realize that you’re wasting development time and throwing ad dollars away because all of the campaigns are of low quality and therefore ineffective.
Unless you’re a Nigerian scammer who mass emails people all over the world promising high investment returns, you should probably focus on quality over quantity.
Listening Only to Higher-Ranking Employees
Another mistake that some executives make is listening only to high-ranking employees as if one’s rank within an organization automatically makes them more knowledgeable about all matters in and outside their particular area of expertise.
For example, instead of asking a junior web developer, a senior director of public relations may be asked if she approves the hiring of a graphic and web design candidate. While it is true that website graphics are usually public in nature and therefore, a public relations specialist may seem relevant, their relevance is so tangential that it is insignificant. On the other hand, a lower-ranking web developer would be more relevant to approve or disapprove of the candidate since the web developer would have to work closely with the candidate almost daily.
In another example, an executive might consult a chief technology offer or chief information officer instead of a website manager about rearchitecting a website. That’s like consulting a chief medical officer instead of an eye doctor about blurry vision. The fact of the matter is the higher one’s rank, the less specialized they are in specific issues because they are too busy being concerned about high-level issues or with issues spanning many different areas. Just as no doctor can specialize in all areas of health, no one can specialize in all areas of technology or some other vast field.
Executives may assume that if a high-ranking employee can’t provide answers with confidence, then the high-ranking employee can consult the next lower-ranking employee down the chain until someone is knowledgeable enough to provide good answers. This approach may work, depending on the size and situation of your organization, but it is often unnecessary and just wastes people’s time as the information flow may have to pass through multiple layers up and down an org chart instead of just going directly to the source, not to mention the potential of information to change as it passes through many people.
Unclear Job Responsibilities & Expectations
One thing I’ve noticed all too often is not knowing what people’s job responsibilities are and what we can expect from them. For example, there could be a director of content marketing as the primary point of contact for all matters related to content. When interviewing the person, it was not made clear what types of work they’d need to be responsible for. The assumption was that the director of content marketing just “owned” content. After hiring the individual, it became clear that he wanted to “own” as much as possible without actually doing as much as possible. One expectation of this employee was that he’d review content and approve it for publication. “Review” in this case can mean many things. It could mean to review the high-level messaging. It could mean to review and fix typos. It can also mean both and anything else related to content. This is where problems occur. Clear responsibilities and expectations were not set in the job description and after hiring. As a result, the employee became unhappy, employees who had to work with him became unhappy, and the employer wasted time and money.
Some employers will intentionally make a job description vague so that it could be interpreted in many different ways so the employer could tell the employee that some new task is part of their responsibility. This is a bad approach that will likely backfire. Tricking an employee to do something they didn’t expect to have to do will result in resentment and “quiet-quitting”, the act of doing the least amount of work just to not get fired. Unhappy employees become unmotivated to excel which would affect company performance.
I once interviewed a candidate for a director of content marketing position. I interviewed the candidate for almost 2 hours. I gave her as many examples as I could of the type of work she’d be responsible for and told her straight up that if she wasn’t interested in being responsible for certain tasks, then she was probably not a good fit. She said she was fine with everything, but she eventually didn’t get hired. Nevertheless, it’s better to be specific, thorough, and set clear expectations up front rather than have regrets later on.
Another example is in defining the job responsibilities of a director of brand and creative. Different people have different interpretations of what brand and creative entails. Some interpretations are
ensuring a company’s logo is used properly
creating print and/or web graphics
design user interfaces
owning all aspects of “creative” which includes both text and graphics content
being a hands-on contributor or just directing other people to be hands-on
The sky’s the limit when it comes to the various ways you can interpret what a director of brand and creative should be responsible for and what they should actually do. If the expectation is that they should not be hands-on yet he should own all graphics, then the company should expect to hire more people who will be hands-on graphics editors.
Without clear, upfront expectations, there’s bound to be disappointment and regret from both parties. Rather than waste everyone’s time and the company’s money, it’s better to be as clear as possible before giving someone a job offer.
This post will compare various aspects of a 2019 Toyota Prius Prime to a Tesla Model 3 in California. It assumes the buyer has a credit score of 870 and can get financing for 72 months (6 years) at 4.6%.
2019 Toyota Prius Plus Hatchback 4D2019 Telsa Standard Range Plus Sedan 4D
TL;DR:
The total purchase price including interest for the Tesla is $16,875 more than for the Prius.
For insurance, the Tesla will cost about $50 to $100 more per month than the Prius.
The Tesla can only go 220 miles before needing to be recharged whereas the Prius can go 640 miles on one full battery and small 11.4-gallon tank of gas.
The EV tax credit situation has changed since this post was originally published.
Vehicle
Oct 2022
Oct 2023
Tesla Model 3
No tax credit
$7500
Tesla Model Y
No tax credit
$7500
Prius Prime
No tax credit
No tax credit
MSRP
EV prices have changed since this post was originally published.
Vehicle
Oct 2022
Oct 2023
Tesla Model 3
$45,416 (cheapest)
$39K – $51K
Tesla Model Y
$65K – $68K
$44K – $52,500
Prius Prime
~$35,000
$32,350 – $39,170
Here’s a cost comparison of the Prius Prime top trim to the Tesla Model Y Performance trim in Oct 2022 and 2023. The loan assumption is 6 years at 4.6%.
Prius Prime
Tesla Model Y
Purchase Price
$35,000
$68,000
Tax (11%)
$3,850
$7,480
Extended Warranty
$2,000
$2,000
Down Payment
$10,000
$10,000
Financing Monthly Payment
~$400
~$920
Total Loan Cost
~$4,000
~$8,500
Total Cost with Interest
~$45,000
~$84,000
In Oct 2023, a Tesla Model Y Performance would have a total cost of approximately $39K more than the Prius Prime XLE. The loan assumption is 6 years at 6.5%.
Now, let’s compare the costs today in October 2023.
Prius Prime
Tesla Model Y
Purchase Price
$39,170
$52,500
Tax (11%)
$4,308
$5,775
Down Payment
$10,000
$10,000
Financing Monthly Payment
$490
$714
Total Loan Cost
$6,134
$8,938
Tax Credit
$0
$7500
Total Cost with Interest Minux Tax Credit
~$49,612
~$59,713
So, after the $7500 tax credit, the Tesla Model Y would cost approximately $10K more than the Prius Prime XLE.
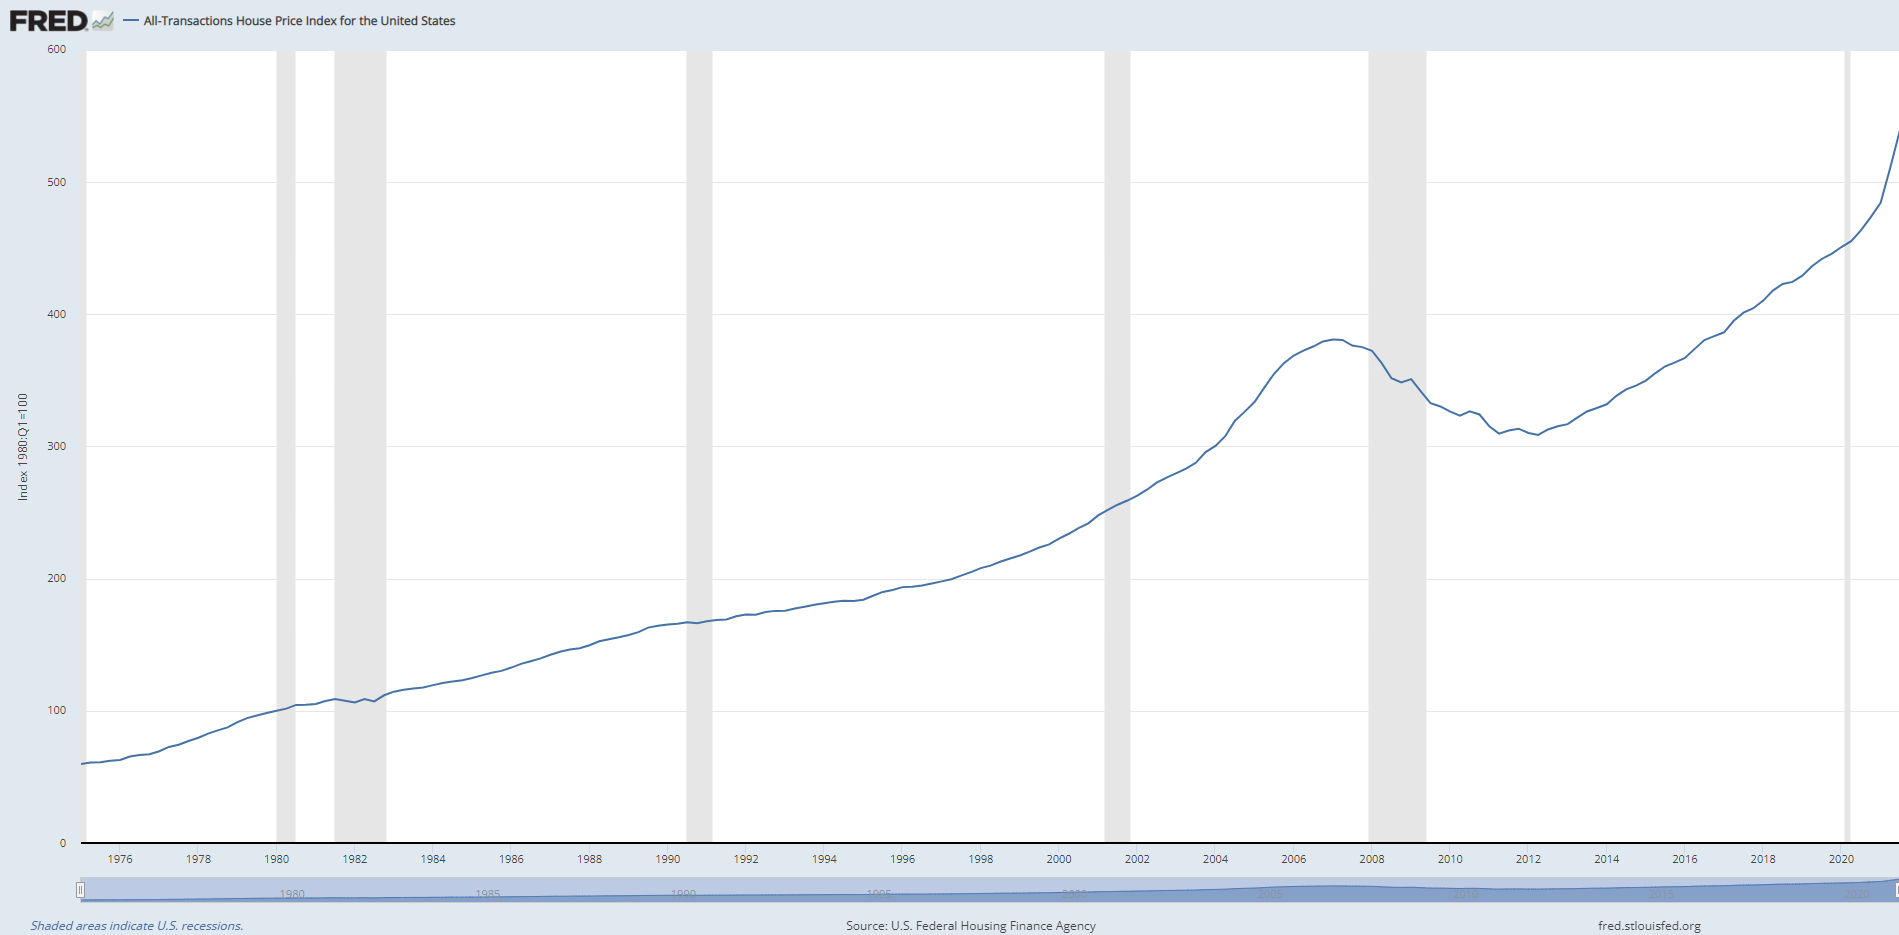
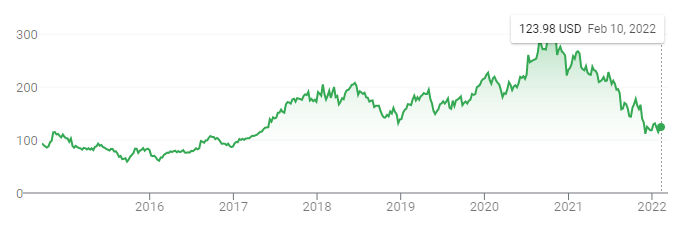
I haven’t invested in the stock market because of its volatility and because no one I know seems to know what they are doing or have made lots of money doing it. Maybe I’m around the wrong people. I invest in real estate for the reasons listed here. If we look at a graph of house prices in the US, their values have always gone up despite occasional dips. That’s the kind of graph you want to see.
House price index for California from 1975 to 2021
Though you can make a lot of money investing in real estate, you can make even more if you invest early in certain stocks. The problem is in knowing which stocks to invest in.
DISCLAIMER: I am not a professional stock market investor. At the time of this writing, the only stocks I own are the ones given to me by my employer. This article is just my personal opinion at the time of this writing.
Investing in Index Funds
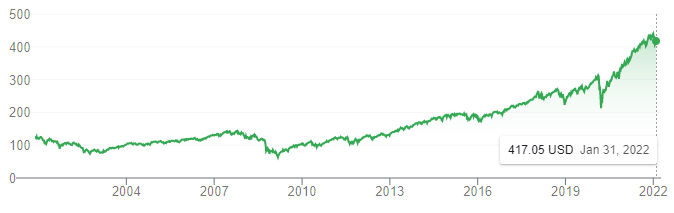
Warren Buffett, known as the “Oracle of Omaha,” is an American businessman and philanthropist, widely considered the most successful investor of the 20th century. He has amassed a personal fortune of more than $60 billion by defying prevailing investment trends. Instead of stock picking, Buffett suggested investing in a low-cost index fund. “I recommend the S&P 500 index fund,” Buffett said, which holds 500 of the largest companies in the U.S., “and have for a long, long time to people.” … “I just think that the best thing to do is buy 90% in S&P 500 index fund.” He specifically identifies Vanguard’s S&P 500 index fund. Vanguard offers both a mutual fund (VFIAX) and ETF (VOO) version of this fund. He recommends the other 10% of the portfolio go to a low-cost index fund that invests in U.S. short-term government bonds. Below are stock charts for VFIAX and VOO.
VFIAXVOO
As you can see, both have an overall consistent upward trend. If you invested in each one 10 years ago, in 2012, you could have quadrupled your investment. Twelve years ago, one share of each was about $100. And now, each is around $400. But, if you only bought 1 share, then you would have only made $300 in 12 years. What if you invest $10,000 at the time. Then, you would have made $30,000 in 12 years. Or, instead of putting 20% down on a $400K house, you put $100K in one of these funds. Then in 12 years, you would have made $300K. Though that’s not bad, you would make more in real estate, especially if you include rental income, but then again, owning rental properties is not 100% passive. Nevertheless, if you don’t want to or can’t invest in real estate, then investing in one of these funds over the long term appears to be a safe bet.
Stock Picking
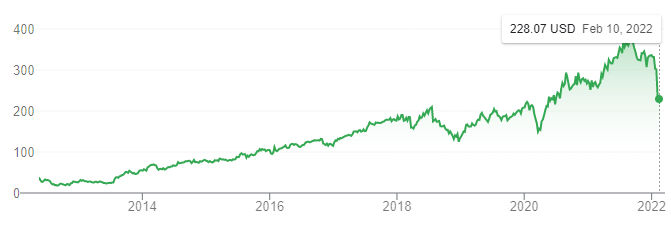
If you want to pick stocks, you obviously want to pick ones that have the potential to grow fast. Tech companies seem to get more publicity for many reasons such as everyone’s familiarity with them and their potential to change the way we live. For example, there was a ton of publicity before and during Facebook’s IPO. Everyone knew what Facebook was at the time. Facebook went public on May 18, 2012, and shares closed the first day of trading at $38.23. Now, the value is $228. That’s a 6x increase in 10 years. When you invest in stocks, the general advice is you shouldn’t invest more than you can feel comfortable losing. At the time, I probably wouldn’t have minded losing $1000. Had I invested $1K in FB, the investment would be worth about $6K now (10 years later) for a $5K profit. That’s still a very petty profit. If I had $50K, which is about the cost of a down payment on a $250K house at the time, then the investment would be worth $300K now for a $250K profit. While that is a good profit, there’s no way I would have invested $50K in FB at the time because I would not have felt comfortable losing it all. With real estate investing, however, it’s so much safer and predictable that one need not worry about their losing their investment. Plus, had I invested $50K in real estate instead of FB, I would still have made a profit of $250K or more in the same period.
Following are stock price graphs of some of the biggest and most popular tech companies along with how much you could have made if 10 years ago you had invested $1000 in each.
FACEBOOK (FB)
IPO date: May 18, 2012
Opening price: $38
Price in 2012: ~38
Price in 2022: ~ $300
Price increase factor: 7.9x
Profit from $1K investment: $6900
Microsoft (MSFT)
IPO date: March 13, 1986
Opening price: $21
Price in 2012: ~50
Price in 2022: ~ $320
Price increase factor: 6.4x
Profit from $1K investment: $6400
Apple (AAPL)
IPO date: December 12, 1980
Opening price: $22
Price in 2012: ~25
Price in 2022: ~ $155
Price increase factor: 6.2x
Profit from $1K investment: $6200
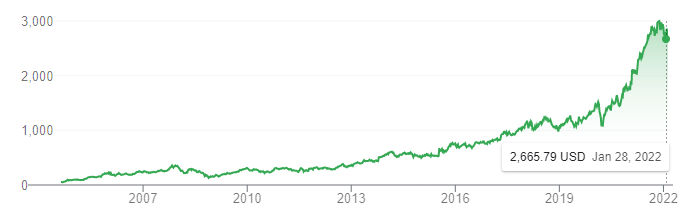
Amazon (AMZN)
IPO date: May 15, 1997
Opening price: $18
Price in 2012: ~200
Price in 2022: ~ $3200
Price increase factor: 16x
Profit from $1K investment: $15000
Alphabet (GOOG)
IPO date: May 15, 1997
Opening price: $18
Price in 2012: ~200
Price in 2022: ~ $3200
Price increase factor: 16x
Profit from $1K investment: $15000
Alibaba (BABA)
IPO date: Sept. 14, 2014
Opening price: $68
Price in 2022: ~ $125
Price increase factor: 1.8x
Profit from $1K investment: $800
Netflix (NFLX)
IPO date: May 23, 2002
Opening price: $15
Price in 2012: ~15
Price in 2022: ~ $400
Price increase factor: 26x
Profit from $1K investment: $25000
Disruptive Technologies
Disruptive technologies also have a large potential for a huge gain. Everyone has heard of Tesla, the automaker that has proven that electric vehicles can replace gas vehicles. Then there’s Bitcoin which revolutionizes money.
Tesla (TSLA)
IPO date: June 29, 2010
Opening price: $3.84
Price in 2012: ~6
Price in 2022: ~ $1000
Price increase factor: 166x
Profit from $1K investment: $165000
Bitcoin (BTC)
Price in 2012: ~$320
Price in 2022: ~ $43000
Price increase factor: 134x
Profit from $1K investment: $132000
Conclusion
Based on the analysis above, if you are going to hold on to popular tech stocks for the long term, e.g. 10 years, then you’re probably safe in that you won’t lose money and will likely profit. Of course, how much you profit will depend a lot on how much you invest and luck. One pattern to note is the performance of disruptive tech (electric cars, cryptocurrency) which realized the biggest gains. Considering the above, I think a safe and good investment diversification strategy, if you are comfortable managing rental properties, is
75% real estate
5% S&P 500 index fund – mutual fund (VFIAX) and/or ETF (VOO)
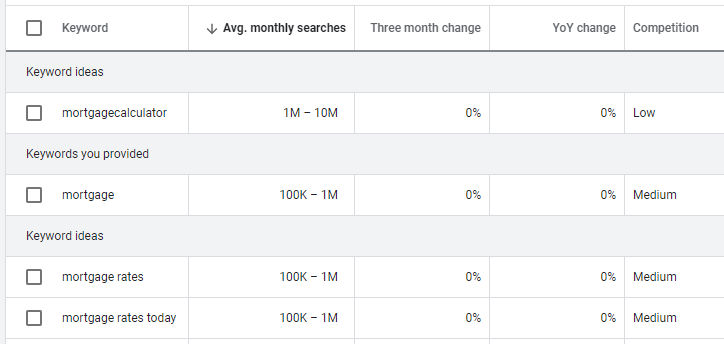
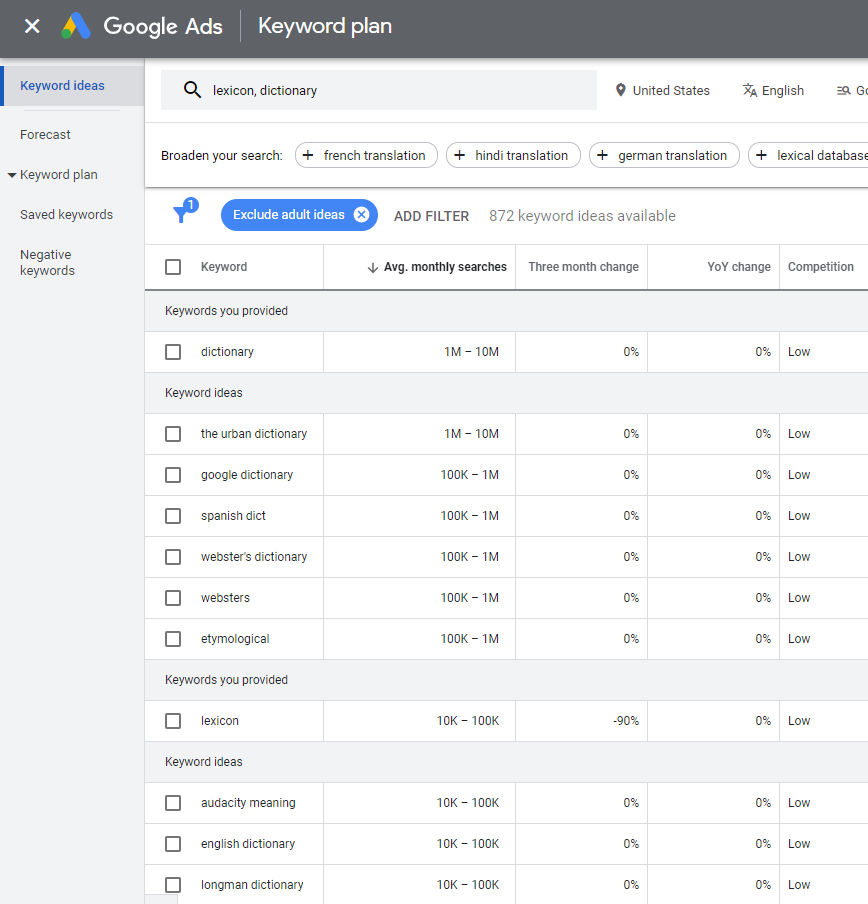
If you have a website or are publishing an article online, you can increase your chances of people finding it by carefully choosing keywords to use both in the domain, folder path, and page content. One tool to help with this is Google Adword’s Keyword Planner. As a trivial example, let’s say you are building a dictionary website. You could buy a domain name that has the word “dictionary” in it or you could use the word “dictionary” in your page content. Or, you could use a synonym like “lexicon”. If you enter both words in the Keyword Planner, you’ll see the average monthly search volume for those words. In addition, Google will offer keyword ideas. As you can see in the screenshot below, many more people search using the term “dictionary” than they do the term “lexicon”. You can also see the competition level in the Competition column. However, that’s for if you want to pay Google to place your link at the top of search results. In the example below, the competition is low for both keywords.
Now, since “dictionary” is a popular term, you can expect more competition with respect to organic (not paid) search results. As you can see below, there are 4.32 billion results for the term “dictionary” and 3.05 billion for “lexicon”.
Of course, you’re not going to just write “dictionary” in your website content. You’ll probably write something like “Chinese – English dictionary” or “Spanish – English dictionary” which will have different average monthly searches and search results.
If you are a real estate investor and have one or more rentals you’ve accumulated over time, there’s a good chance you have a good amount of equity in at least one of your properties – maybe even your primary residence. You might feel happy that you have a lot of equity but from an investment point of view, you could be making more money — potentially A LOT more — if you pull out some of that equity to re-invest it rather than leave it in the form of equity for an existing property. Compare the following two scenarios.
Scenario 1
Let’s say you have 3 properties. One is your primary residence which you live in and are not renting out. The other two are rentals.
Current Value
Equity
Rental Income (monthly)
Primary Residence
$1,000,000
$600,000
$0
Rental 1 (townhouse)
$750,000
$650,000
$2,500
Rental 2 (triplex)
$590,000
$100,000
$4,820
Appreciation
Now, let’s estimate the value + appreciation on each property per year over 10 years. The average annual appreciation rate in California is 6.77%. We can easily calculate the appreciation using the calculator at
In the last row, we see the total appreciation over 10 years.
Year
Primary Residence
Rental 1
Rental 2
1
$1,067,700
$800,775
$629,943
2
$1,139,983
$854,987
$672,590
3
$1,217,160
$912,870
$718,124
4
$1,299,562
$974,671
$766,742
5
$1,387,542
$1,040,657
$818,650
6
$1,481,479
$1,111,109
$874,073
7
$1,581,775
$1,186,331
$933,247
8
$1,688,861
$1,266,646
$996,428
9
$1,803,197
$1,352,398
$1,063,886
10
$1,925,273
$1,443,955
$1,135,911
Diff
$925,273
$693,955
$545,911
Rental Income
Now, let’s estimate the annual gross rental income and per year over 10 years. For simplicity, and to be conservative, we’ll keep the monthly rent fixed (we’ll never increase the rent), although in reality, in California you can legally increase the rent by at least 5% per year. In the last row, we see the total gross rental income over 10 years. Of course, you’ll have expenses like debt service (paying your mortgage), taxes, operational costs, etc which will reduce this total rental income.
Year
Primary Residence
Rental 1
Rental 2
1
0
0
$0
2
0
$30,000
$57,840
3
0
$30,000
$57,840
4
0
$30,000
$57,840
5
0
$30,000
$57,840
6
0
$30,000
$57,840
7
0
$30,000
$57,840
8
0
$30,000
$57,840
9
0
$30,000
$57,840
10
0
$30,000
$57,840
Total
0
$270,000
$520,560
Total Return on Investment
Now, if we add the appreciation and rental income minus expenses over 10 years, we’d get our total return on investment (ROI). But, since expenses vary from one property to another, to be conservative and keep things simple, we’ll just look at the total appreciation.
Over 10 years, our investments will have appreciated by $2,165,140.
Now, let’s compare this to another scenario where we do cash-out refinance and reinvest the money in more rental properties.
Scenario 2
In this scenario, we decide whether to do cash-out refinance for each existing property.
Primary residence
For the primary residence, we won’t refinance it and take cash out because doing so would increase the mortgage and since it’s not a rental, you’d have to pay for that increase yourself. Of course, if you can afford it, you could also do a cash-out refinance on that property as well, but it’s not a good idea to spread yourself too thin.
Rental #1
For rental #1, we do a cash-out refinance to pull out 75% of the equity. In doing so, our monthly mortgage pay for that property will go up but if you plan it correctly, your income will cover your new expenses, especially if your previous loan would be paid off in, say, 10 years, and you refinance to 30 years which would lower your monthly payments despite having borrowed more money.
Rental #2
For rental #2, there isn’t enough equity in the property so we can’t refinance it.
Current Value
Current Equity
Cash-out refi 75% of value
New Equity
Primary Residence
$1,000,000
$600,000
No refi
$600,000
Rental 1
$750,000
$650,000
$562,500
$100,000
Rental 2
$590,000
$100,000
No refi
$100,000
Total
$562,500
According to the table above, we’re able to pull out $562,500 from Rental #1 which we’ll use as a down payment to purchase more rental properties. Let’s say we buy 4 duplexes at $500,000 each and we put down 25% (standard for investment properties) which is $125,000 for each. That leaves us with $62,500 for closing costs and some home improvement. We’ll estimate the rental income for each duplex is $3500 per month.
Current Value
Equity
Rental Income (monthly)
Rental 3 (duplex)
$500,000
$125,000
$3,500
Rental 4 (duplex)
$500,000
$125,000
$3,500
Rental 5 (duplex)
$500,000
$125,000
$3,500
Rental 6 (duplex)
$500,000
$125,000
$3,500
Appreciation
Now, like in scenario 1, let’s estimate the appreciation over 10 years.
Year
Rental 3
Rental 4
Rental 5
Rental 6
1
$533,850
$533,850
$533,850
$533,850
2
$569,992
$569,992
$569,992
$569,992
3
$608,580
$608,580
$608,580
$608,580
4
$649,781
$649,781
$649,781
$649,781
5
$693,771
$693,771
$693,771
$693,771
6
$740,739
$740,739
$740,739
$740,739
7
$790,887
$790,887
$790,887
$790,887
8
$844,431
$844,431
$844,431
$844,431
9
$901,599
$901,599
$901,599
$901,599
10
$962,637
$962,637
$962,637
$962,637
Diff
$428,787
$428,787
$428,787
$428,787
Rental Income
Now, like in scenario 1, let’s estimate the annual gross rental income and per year over 10 years.
Year
Rental 3
Rental 4
Rental 5
Rental 6
1
$42,000
$42,000
$42,000
$42,000
2
$42,000
$42,000
$42,000
$42,000
3
$42,000
$42,000
$42,000
$42,000
4
$42,000
$42,000
$42,000
$42,000
5
$42,000
$42,000
$42,000
$42,000
6
$42,000
$42,000
$42,000
$42,000
7
$42,000
$42,000
$42,000
$42,000
8
$42,000
$42,000
$42,000
$42,000
9
$42,000
$42,000
$42,000
$42,000
10
$42,000
$42,000
$42,000
$42,000
Total
$420,000
$420,000
$420,000
$420,000
Total Return on Investment
Now, let’s calculate the total ROI. Again, to be conservative and for simplicity, we’ll just consider total appreciation even though we know the total ROI will be much more than that since every month for 10 years we’ll be paying down the mortgage using the rental income which increases our equity in each property.
The total appreciation over 10 years in scenarios 1 and 2 are
Therefore, using a very conservative estimate, we could make an additional $1,715,147 over 10 years if we refinanced and reinvested the equity in our existing properties.
What to do after 10 years
Let’s say you hold on to the properties for 10 years. You’ll most likely have a mortgage on all or some of properties. At that point, you could choose to sell some of the properties to pay off all of your mortgages and live mortgage free! You’ll still be getting rental income from the remaining rental properties which may even amount to as much or more as your work income from a day job in which case you could choose to just retire and travel the world.